

Evaluations as Sets over Lattices – Application Point of View
97
Table 2 A fictitious data set
with 11 objects
x(1), . . . ,x(11) and two
indicators q(1) and q(2)
q(1) q(2)
x(1)
0
0
x(2)
0.1
0.1
x(3)
0.2
0.2
x(4)
0.3
0.3
x(5)
0.4
0.4
x(6)
0.5
0.5
x(7)
0.6
0.6
x(8)
0.7
0.7
x(9)
0.8
0.8
x(10) 0.9
0.9
x(11) 1.0
z
1,2
1
1,8
0,6
0,4
0,2
0
0
0,2
0,4
0,6
0,8
1
1,2
correl
tvq1impq2
tvq2impq1
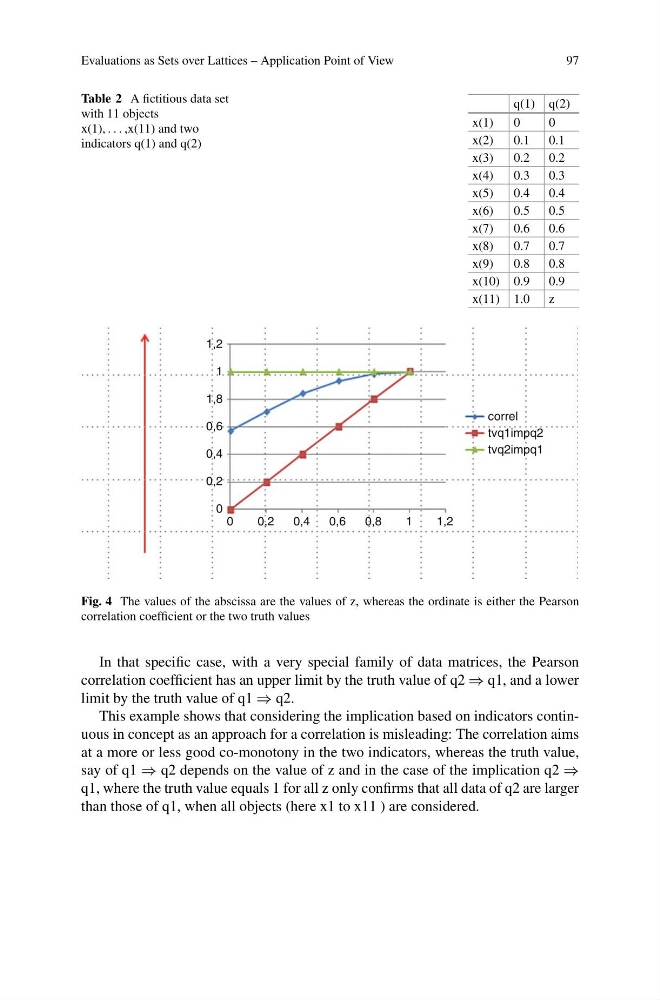
Fig. 4 The values of the abscissa are the values of z, whereas the ordinate is either the Pearson
correlation coefficient or the two truth values
In that specific case, with a very special family of data matrices, the Pearson
correlation coefficient has an upper limit by the truth value of q2 ⇒ q1, and a lower
limit by the truth value of q1 ⇒ q2.
This example shows that considering the implication based on indicators continuous in concept as an approach for a correlation is misleading: The correlation aims
at a more or less good co-monotony in the two indicators, whereas the truth value,
say of q1 ⇒ q2 depends on the value of z and in the case of the implication q2 ⇒
q1, where the truth value equals 1 for all z only confirms that all data of q2 are larger
than those of q1, when all objects (here x1 to x11 ) are considered.
97
Table 2 A fictitious data set
with 11 objects
x(1), . . . ,x(11) and two
indicators q(1) and q(2)
q(1) q(2)
x(1)
0
0
x(2)
0.1
0.1
x(3)
0.2
0.2
x(4)
0.3
0.3
x(5)
0.4
0.4
x(6)
0.5
0.5
x(7)
0.6
0.6
x(8)
0.7
0.7
x(9)
0.8
0.8
x(10) 0.9
0.9
x(11) 1.0
z
1,2
1
1,8
0,6
0,4
0,2
0
0
0,2
0,4
0,6
0,8
1
1,2
correl
tvq1impq2
tvq2impq1
Fig. 4 The values of the abscissa are the values of z, whereas the ordinate is either the Pearson
correlation coefficient or the two truth values
In that specific case, with a very special family of data matrices, the Pearson
correlation coefficient has an upper limit by the truth value of q2 ⇒ q1, and a lower
limit by the truth value of q1 ⇒ q2.
This example shows that considering the implication based on indicators continuous in concept as an approach for a correlation is misleading: The correlation aims
at a more or less good co-monotony in the two indicators, whereas the truth value,
say of q1 ⇒ q2 depends on the value of z and in the case of the implication q2 ⇒
q1, where the truth value equals 1 for all z only confirms that all data of q2 are larger
than those of q1, when all objects (here x1 to x11 ) are considered.