

96
R. Bruggemann and A. Kerber
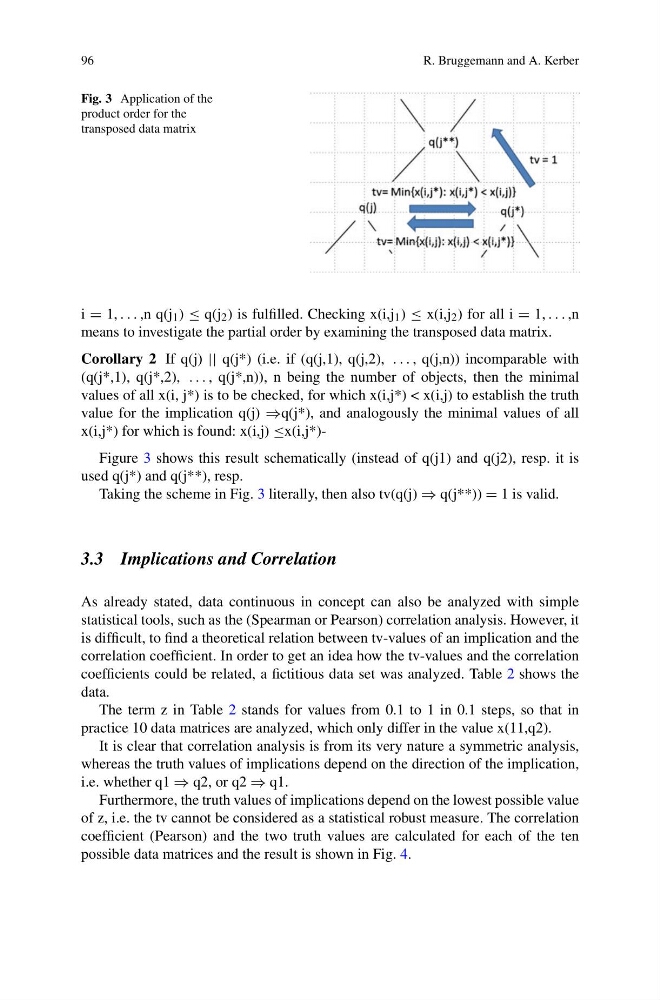
Fig. 3 Application of the
product order for the
transposed data matrix
i = 1, . . . ,n q(j 1 ) ≤ q(j 2 ) is fulfilled. Checking x(i,j 1 ) ≤ x(i,j 2 ) for all i = 1, . . . ,n
means to investigate the partial order by examining the transposed data matrix.
Corollary 2 If q(j) || q(j*) (i.e. if (q(j,1), q(j,2), . . . , q(j,n)) incomparable with
(q(j*,1), q(j*,2), . . . , q(j*,n)), n being the number of objects, then the minimal
values of all x(i, j*) is to be checked, for which x(i,j*) < x(i,j) to establish the truth
value for the implication q(j) ⇒q(j*), and analogously the minimal values of all
x(i,j*) for which is found: x(i,j) ≤x(i,j*)Figure 3 shows this result schematically (instead of q(j1) and q(j2), resp. it is
used q(j*) and q(j**), resp.
Taking the scheme in Fig. 3 literally, then also tv(q(j) ⇒ q(j**)) = 1 is valid.
3.3 Implications and Correlation
As already stated, data continuous in concept can also be analyzed with simple
statistical tools, such as the (Spearman or Pearson) correlation analysis. However, it
is difficult, to find a theoretical relation between tv-values of an implication and the
correlation coefficient. In order to get an idea how the tv-values and the correlation
coefficients could be related, a fictitious data set was analyzed. Table 2 shows the
data.
The term z in Table 2 stands for values from 0.1 to 1 in 0.1 steps, so that in
practice 10 data matrices are analyzed, which only differ in the value x(11,q2).
It is clear that correlation analysis is from its very nature a symmetric analysis,
whereas the truth values of implications depend on the direction of the implication,
i.e. whether q1 ⇒ q2, or q2 ⇒ q1.
Furthermore, the truth values of implications depend on the lowest possible value
of z, i.e. the tv cannot be considered as a statistical robust measure. The correlation
coefficient (Pearson) and the two truth values are calculated for each of the ten
possible data matrices and the result is shown in Fig. 4.
R. Bruggemann and A. Kerber
Fig. 3 Application of the
product order for the
transposed data matrix
i = 1, . . . ,n q(j 1 ) ≤ q(j 2 ) is fulfilled. Checking x(i,j 1 ) ≤ x(i,j 2 ) for all i = 1, . . . ,n
means to investigate the partial order by examining the transposed data matrix.
Corollary 2 If q(j) || q(j*) (i.e. if (q(j,1), q(j,2), . . . , q(j,n)) incomparable with
(q(j*,1), q(j*,2), . . . , q(j*,n)), n being the number of objects, then the minimal
values of all x(i, j*) is to be checked, for which x(i,j*) < x(i,j) to establish the truth
value for the implication q(j) ⇒q(j*), and analogously the minimal values of all
x(i,j*) for which is found: x(i,j) ≤x(i,j*)Figure 3 shows this result schematically (instead of q(j1) and q(j2), resp. it is
used q(j*) and q(j**), resp.
Taking the scheme in Fig. 3 literally, then also tv(q(j) ⇒ q(j**)) = 1 is valid.
3.3 Implications and Correlation
As already stated, data continuous in concept can also be analyzed with simple
statistical tools, such as the (Spearman or Pearson) correlation analysis. However, it
is difficult, to find a theoretical relation between tv-values of an implication and the
correlation coefficient. In order to get an idea how the tv-values and the correlation
coefficients could be related, a fictitious data set was analyzed. Table 2 shows the
data.
The term z in Table 2 stands for values from 0.1 to 1 in 0.1 steps, so that in
practice 10 data matrices are analyzed, which only differ in the value x(11,q2).
It is clear that correlation analysis is from its very nature a symmetric analysis,
whereas the truth values of implications depend on the direction of the implication,
i.e. whether q1 ⇒ q2, or q2 ⇒ q1.
Furthermore, the truth values of implications depend on the lowest possible value
of z, i.e. the tv cannot be considered as a statistical robust measure. The correlation
coefficient (Pearson) and the two truth values are calculated for each of the ten
possible data matrices and the result is shown in Fig. 4.