

54
1.6. THE SECOND DERIVATIVE
the time intervals [0, 1], [1, 2], [2, 3], [3, 4], and [4, 5], plus provide commentary
overall on what the car is doing on the interval [0, 12].
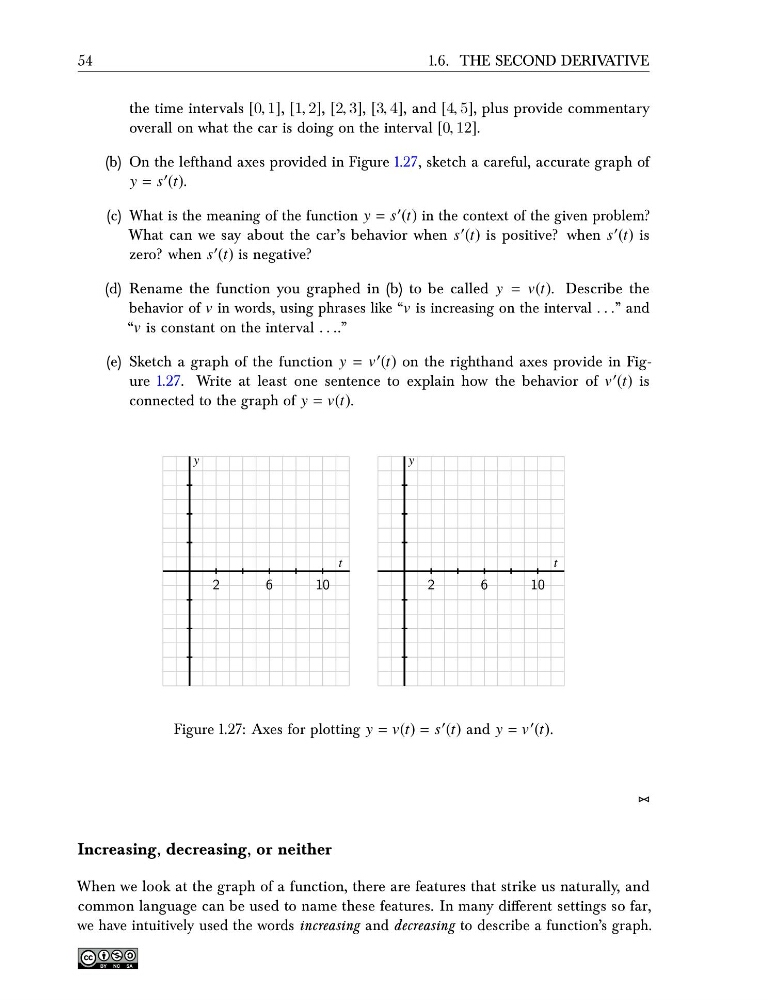
(b) On the lefthand axes provided in Figure 1.27, sketch a careful, accurate graph of
y = s ′ (t).
(c) What is the meaning of the function y = s ′ (t) in the context of the given problem?
What can we say about the car’s behavior when s ′ (t) is positive? when s ′ (t) is
zero? when s ′ (t) is negative?
(d) Rename the function you graphed in (b) to be called y = v(t). Describe the
behavior of v in words, using phrases like “v is increasing on the interval . . .” and
“v is constant on the interval . . ..”
(e) Sketch a graph of the function y = v ′ (t) on the righthand axes provide in Figure 1.27. Write at least one sentence to explain how the behavior of v ′ (t) is
connected to the graph of y = v(t).
2
6
10
t
y
2
6
10
t
y
Figure 1.27: Axes for plotting y = v(t) = s ′ (t) and y = v ′ (t).
⊲⊳
Increasing, decreasing, or neither
When we look at the graph of a function, there are features that strike us naturally, and
common language can be used to name these features. In many different settings so far,
we have intuitively used the words increasing and decreasing to describe a function’s graph.
1.6. THE SECOND DERIVATIVE
the time intervals [0, 1], [1, 2], [2, 3], [3, 4], and [4, 5], plus provide commentary
overall on what the car is doing on the interval [0, 12].
(b) On the lefthand axes provided in Figure 1.27, sketch a careful, accurate graph of
y = s ′ (t).
(c) What is the meaning of the function y = s ′ (t) in the context of the given problem?
What can we say about the car’s behavior when s ′ (t) is positive? when s ′ (t) is
zero? when s ′ (t) is negative?
(d) Rename the function you graphed in (b) to be called y = v(t). Describe the
behavior of v in words, using phrases like “v is increasing on the interval . . .” and
“v is constant on the interval . . ..”
(e) Sketch a graph of the function y = v ′ (t) on the righthand axes provide in Figure 1.27. Write at least one sentence to explain how the behavior of v ′ (t) is
connected to the graph of y = v(t).
2
6
10
t
y
2
6
10
t
y
Figure 1.27: Axes for plotting y = v(t) = s ′ (t) and y = v ′ (t).
⊲⊳
Increasing, decreasing, or neither
When we look at the graph of a function, there are features that strike us naturally, and
common language can be used to name these features. In many different settings so far,
we have intuitively used the words increasing and decreasing to describe a function’s graph.