

7.2. QUALITATIVE BEHAVIOR OF SOLUTIONS TO DES
405
Conversely, an equilibrium solution y is called unstable if nearby solutions are
pushed away from y.
Using your work above, classify the equilibrium solutions you found in (b) as
either stable or unstable.
(f) Suppose that y(t) describes the population of a species of living organisms and
that the initial value y(0) is positive. What can you say about the eventual fate
of this population?
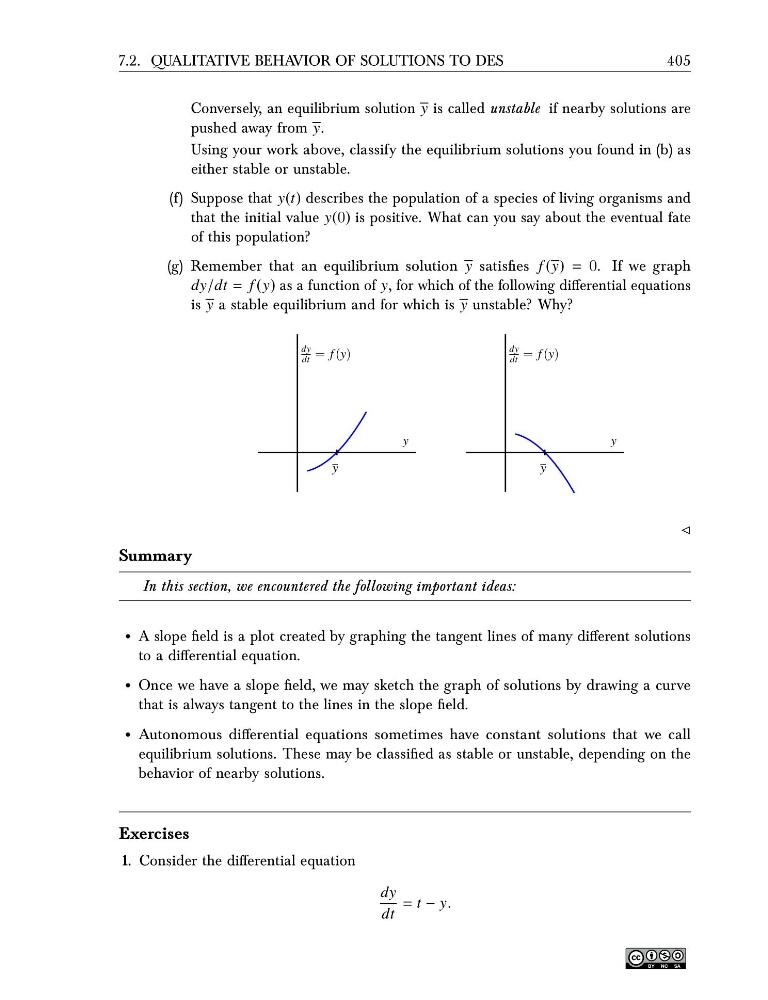
(g) Remember that an equilibrium solution y satisfies f (y) = 0. If we graph
dy/dt = f (y) as a function of y, for which of the following differential equations
is y a stable equilibrium and for which is y unstable? Why?
y
y
dy
dt = f (y)
y
y
dy
dt = f (y)
⊳
Summary
In this section, we encountered the following important ideas:
• A slope field is a plot created by graphing the tangent lines of many different solutions
to a differential equation.
• Once we have a slope field, we may sketch the graph of solutions by drawing a curve
that is always tangent to the lines in the slope field.
• Autonomous differential equations sometimes have constant solutions that we call
equilibrium solutions. These may be classified as stable or unstable, depending on the
behavior of nearby solutions.
Exercises
1. Consider the differential equation
dy
dt
= t − y.
405
Conversely, an equilibrium solution y is called unstable if nearby solutions are
pushed away from y.
Using your work above, classify the equilibrium solutions you found in (b) as
either stable or unstable.
(f) Suppose that y(t) describes the population of a species of living organisms and
that the initial value y(0) is positive. What can you say about the eventual fate
of this population?
(g) Remember that an equilibrium solution y satisfies f (y) = 0. If we graph
dy/dt = f (y) as a function of y, for which of the following differential equations
is y a stable equilibrium and for which is y unstable? Why?
y
y
dy
dt = f (y)
y
y
dy
dt = f (y)
⊳
Summary
In this section, we encountered the following important ideas:
• A slope field is a plot created by graphing the tangent lines of many different solutions
to a differential equation.
• Once we have a slope field, we may sketch the graph of solutions by drawing a curve
that is always tangent to the lines in the slope field.
• Autonomous differential equations sometimes have constant solutions that we call
equilibrium solutions. These may be classified as stable or unstable, depending on the
behavior of nearby solutions.
Exercises
1. Consider the differential equation
dy
dt
= t − y.