

5.1. CONSTRUCTING ACCURATE GRAPHS OF ANTIDERIVATIVES
275
(c) Sketch an accurate graph of C on the axes provided at right in Figure 5.7. Be
certain to label the scale on the vertical axis.
(d) Determine a formula for C that does not involve an integral and is valid for
5 ≤ t ≤ 10.
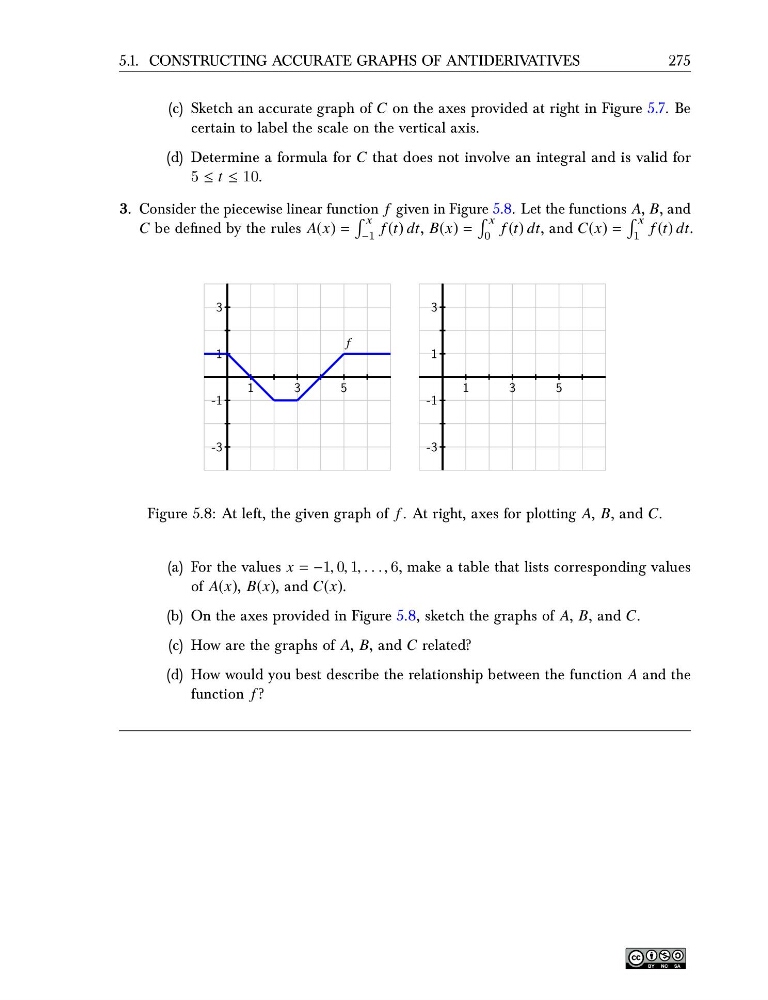
3. Consider the piecewise linear function f given in Figure 5.8. Let the functions A, B, and
C be defined by the rules A(x) =
x
−1
f (t) dt, B(x) =
x
0
f (t) dt, and C(x) =
x
1
f (t) dt.
1
3
5
-3
-1
1
3
f
1
3
5
-3
-1
1
3
Figure 5.8: At left, the given graph of f . At right, axes for plotting A, B, and C.
(a) For the values x = −1, 0, 1, . . . , 6, make a table that lists corresponding values
of A(x), B(x), and C(x).
(b) On the axes provided in Figure 5.8, sketch the graphs of A, B, and C.
(c) How are the graphs of A, B, and C related?
(d) How would you best describe the relationship between the function A and the
function f ?
275
(c) Sketch an accurate graph of C on the axes provided at right in Figure 5.7. Be
certain to label the scale on the vertical axis.
(d) Determine a formula for C that does not involve an integral and is valid for
5 ≤ t ≤ 10.
3. Consider the piecewise linear function f given in Figure 5.8. Let the functions A, B, and
C be defined by the rules A(x) =
x
−1
f (t) dt, B(x) =
x
0
f (t) dt, and C(x) =
x
1
f (t) dt.
1
3
5
-3
-1
1
3
f
1
3
5
-3
-1
1
3
Figure 5.8: At left, the given graph of f . At right, axes for plotting A, B, and C.
(a) For the values x = −1, 0, 1, . . . , 6, make a table that lists corresponding values
of A(x), B(x), and C(x).
(b) On the axes provided in Figure 5.8, sketch the graphs of A, B, and C.
(c) How are the graphs of A, B, and C related?
(d) How would you best describe the relationship between the function A and the
function f ?