

274
5.1. CONSTRUCTING ACCURATE GRAPHS OF ANTIDERIVATIVES
1
6
-3
3
v
A 1
A 2
t
2
4
6
-3
-1
1
3
t
s
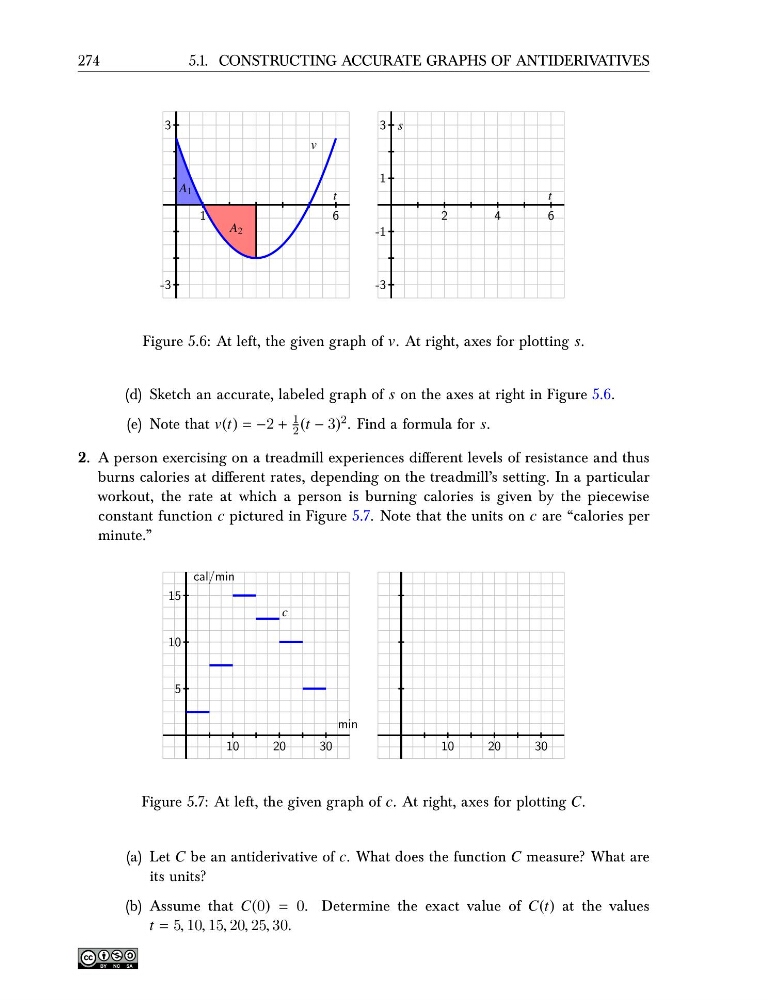
Figure 5.6: At left, the given graph of v. At right, axes for plotting s.
(d) Sketch an accurate, labeled graph of s on the axes at right in Figure 5.6.
(e) Note that v(t) = −2 +
1
2 (t − 3) 2 . Find a formula for s.
2. A person exercising on a treadmill experiences different levels of resistance and thus
burns calories at different rates, depending on the treadmill’s setting. In a particular
workout, the rate at which a person is burning calories is given by the piecewise
constant function c pictured in Figure 5.7. Note that the units on c are “calories per
minute.”
10
20
30
5
10
15
c
cal/min
min
10
20
30
Figure 5.7: At left, the given graph of c. At right, axes for plotting C.
(a) Let C be an antiderivative of c. What does the function C measure? What are
its units?
(b) Assume that C(0) = 0. Determine the exact value of C(t) at the values
t = 5, 10, 15, 20, 25, 30.
5.1. CONSTRUCTING ACCURATE GRAPHS OF ANTIDERIVATIVES
1
6
-3
3
v
A 1
A 2
t
2
4
6
-3
-1
1
3
t
s
Figure 5.6: At left, the given graph of v. At right, axes for plotting s.
(d) Sketch an accurate, labeled graph of s on the axes at right in Figure 5.6.
(e) Note that v(t) = −2 +
1
2 (t − 3) 2 . Find a formula for s.
2. A person exercising on a treadmill experiences different levels of resistance and thus
burns calories at different rates, depending on the treadmill’s setting. In a particular
workout, the rate at which a person is burning calories is given by the piecewise
constant function c pictured in Figure 5.7. Note that the units on c are “calories per
minute.”
10
20
30
5
10
15
c
cal/min
min
10
20
30
Figure 5.7: At left, the given graph of c. At right, axes for plotting C.
(a) Let C be an antiderivative of c. What does the function C measure? What are
its units?
(b) Assume that C(0) = 0. Determine the exact value of C(t) at the values
t = 5, 10, 15, 20, 25, 30.