

4.1. DETERMINING DISTANCE TRAVELED FROM VELOCITY
209
will be used in question (d).
(b) How far did the person travel during the two hours? How is this distance related
to the area of a certain region under the graph of y = v(t)?
(c) Find an algebraic formula, s(t), for the position of the person at time t, assuming
that s(0) = 0. Explain your thinking.
(d) On the right-hand axes provided in Figure 4.1, sketch a labeled graph of the
position function y = s(t).
(e) For what values of t is the position function s increasing? Explain why this is the
case using relevant information about the velocity function v.
⊲⊳
Area under the graph of the velocity function
In Preview Activity 4.1, we encountered a fundamental fact: when a moving object’s velocity
is constant (and positive), the area under the velocity curve over a given interval tells us
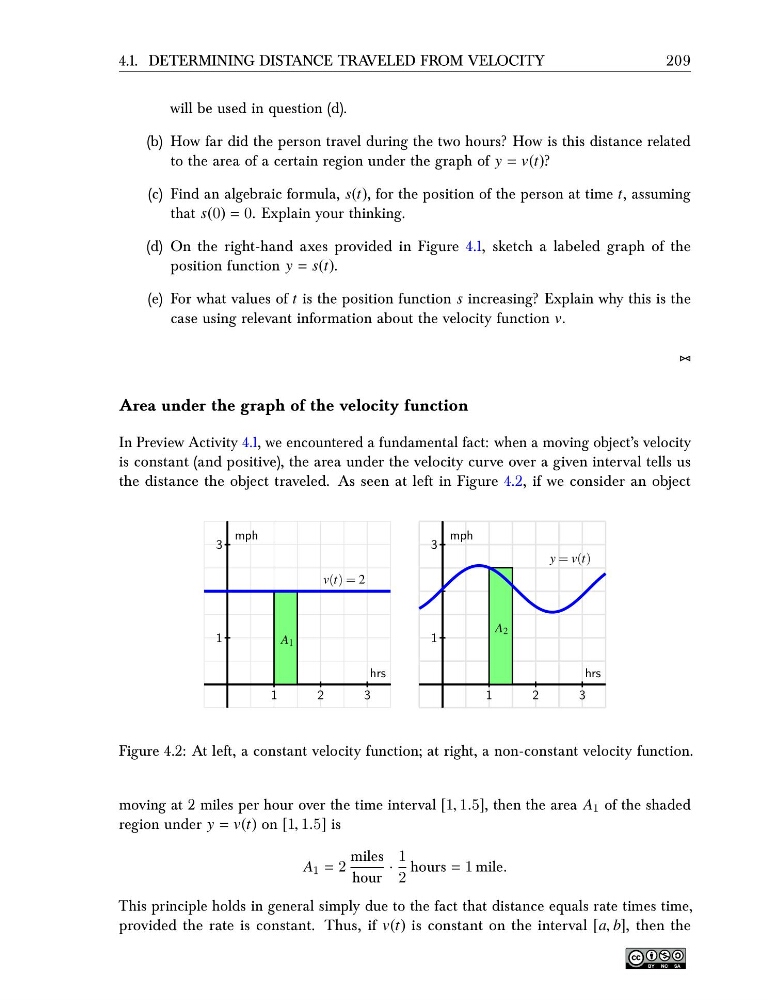
the distance the object traveled. As seen at left in Figure 4.2, if we consider an object
1
2
3
1
3
mph
hrs
v(t) = 2
A 1
1
2
3
1
3
mph
hrs
y = v(t)
A 2
Figure 4.2: At left, a constant velocity function; at right, a non-constant velocity function.
moving at 2 miles per hour over the time interval [1, 1.5], then the area A 1 of the shaded
region under y = v(t) on [1, 1.5] is
A 1 = 2
miles
hour
·
1
2
hours = 1 mile.
This principle holds in general simply due to the fact that distance equals rate times time,
provided the rate is constant. Thus, if v(t) is constant on the interval [a, b], then the
209
will be used in question (d).
(b) How far did the person travel during the two hours? How is this distance related
to the area of a certain region under the graph of y = v(t)?
(c) Find an algebraic formula, s(t), for the position of the person at time t, assuming
that s(0) = 0. Explain your thinking.
(d) On the right-hand axes provided in Figure 4.1, sketch a labeled graph of the
position function y = s(t).
(e) For what values of t is the position function s increasing? Explain why this is the
case using relevant information about the velocity function v.
⊲⊳
Area under the graph of the velocity function
In Preview Activity 4.1, we encountered a fundamental fact: when a moving object’s velocity
is constant (and positive), the area under the velocity curve over a given interval tells us
the distance the object traveled. As seen at left in Figure 4.2, if we consider an object
1
2
3
1
3
mph
hrs
v(t) = 2
A 1
1
2
3
1
3
mph
hrs
y = v(t)
A 2
Figure 4.2: At left, a constant velocity function; at right, a non-constant velocity function.
moving at 2 miles per hour over the time interval [1, 1.5], then the area A 1 of the shaded
region under y = v(t) on [1, 1.5] is
A 1 = 2
miles
hour
·
1
2
hours = 1 mile.
This principle holds in general simply due to the fact that distance equals rate times time,
provided the rate is constant. Thus, if v(t) is constant on the interval [a, b], then the