

172
3.1. USING DERIVATIVES TO IDENTIFY EXTREME VALUES
Exercises
1. This problem concerns a function about which the following information is known:
• f is a differentiable function defined at every real number x
• f (0) = −1/2
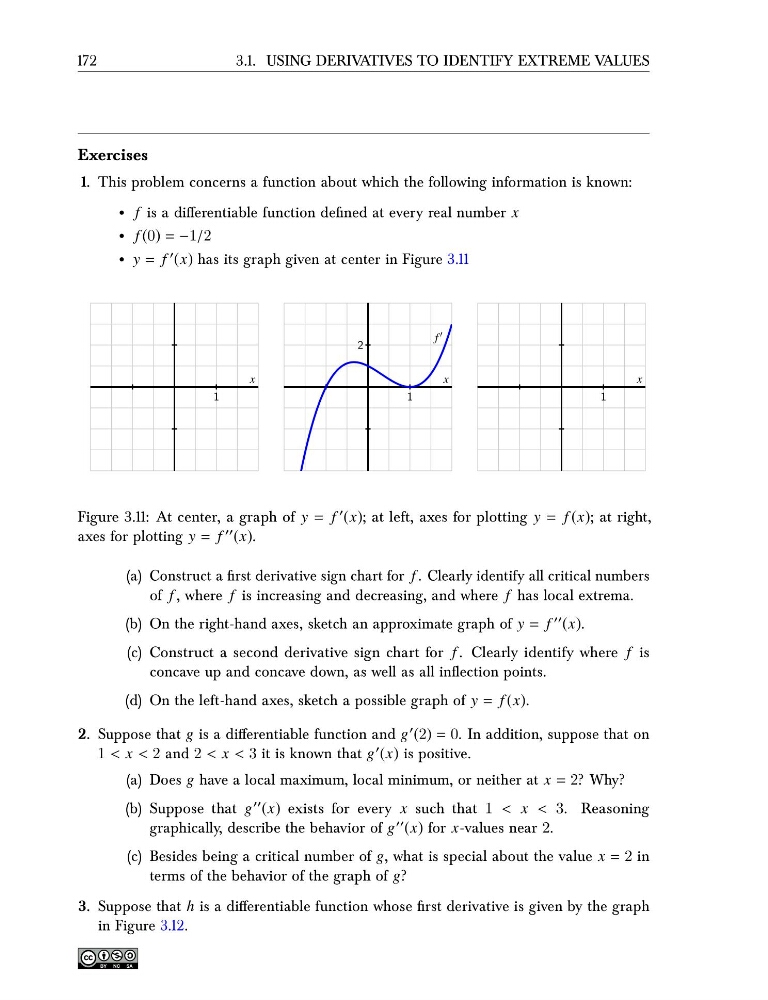
• y = f ′ (x) has its graph given at center in Figure 3.11
1
x
1
2
x
f ′
1
x
Figure 3.11: At center, a graph of y = f ′ (x); at left, axes for plotting y = f (x); at right,
axes for plotting y = f ′′ (x).
(a) Construct a first derivative sign chart for f . Clearly identify all critical numbers
of f , where f is increasing and decreasing, and where f has local extrema.
(b) On the right-hand axes, sketch an approximate graph of y = f ′′ (x).
(c) Construct a second derivative sign chart for f . Clearly identify where f is
concave up and concave down, as well as all inflection points.
(d) On the left-hand axes, sketch a possible graph of y = f (x).
2. Suppose that g is a differentiable function and g ′ (2) = 0. In addition, suppose that on
1 < x < 2 and 2 < x < 3 it is known that g ′ (x) is positive.
(a) Does g have a local maximum, local minimum, or neither at x = 2? Why?
(b) Suppose that g ′′ (x) exists for every x such that 1 < x < 3. Reasoning
graphically, describe the behavior of g ′′ (x) for x-values near 2.
(c) Besides being a critical number of g, what is special about the value x = 2 in
terms of the behavior of the graph of g?
3. Suppose that h is a differentiable function whose first derivative is given by the graph
in Figure 3.12.
3.1. USING DERIVATIVES TO IDENTIFY EXTREME VALUES
Exercises
1. This problem concerns a function about which the following information is known:
• f is a differentiable function defined at every real number x
• f (0) = −1/2
• y = f ′ (x) has its graph given at center in Figure 3.11
1
x
1
2
x
f ′
1
x
Figure 3.11: At center, a graph of y = f ′ (x); at left, axes for plotting y = f (x); at right,
axes for plotting y = f ′′ (x).
(a) Construct a first derivative sign chart for f . Clearly identify all critical numbers
of f , where f is increasing and decreasing, and where f has local extrema.
(b) On the right-hand axes, sketch an approximate graph of y = f ′′ (x).
(c) Construct a second derivative sign chart for f . Clearly identify where f is
concave up and concave down, as well as all inflection points.
(d) On the left-hand axes, sketch a possible graph of y = f (x).
2. Suppose that g is a differentiable function and g ′ (2) = 0. In addition, suppose that on
1 < x < 2 and 2 < x < 3 it is known that g ′ (x) is positive.
(a) Does g have a local maximum, local minimum, or neither at x = 2? Why?
(b) Suppose that g ′′ (x) exists for every x such that 1 < x < 3. Reasoning
graphically, describe the behavior of g ′′ (x) for x-values near 2.
(c) Besides being a critical number of g, what is special about the value x = 2 in
terms of the behavior of the graph of g?
3. Suppose that h is a differentiable function whose first derivative is given by the graph
in Figure 3.12.