

170
3.1. USING DERIVATIVES TO IDENTIFY EXTREME VALUES
f is increasing or decreasing, while the sign of the second derivative f ′′ tells us how the
function f is increasing or decreasing.
Activity 3.2.
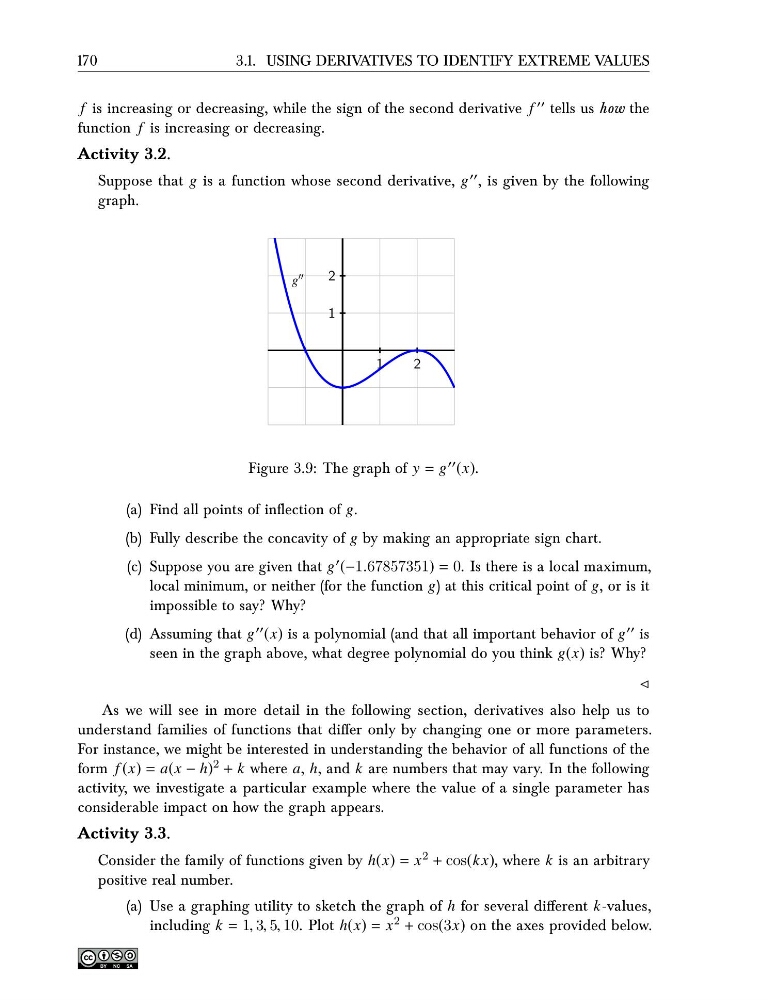
Suppose that g is a function whose second derivative, g ′′ , is given by the following
graph.
1
2
1
2
g ′′
Figure 3.9: The graph of y = g ′′ (x).
(a) Find all points of inflection of g.
(b) Fully describe the concavity of g by making an appropriate sign chart.
(c) Suppose you are given that g ′ (−1.67857351) = 0. Is there is a local maximum,
local minimum, or neither (for the function g) at this critical point of g, or is it
impossible to say? Why?
(d) Assuming that g ′′ (x) is a polynomial (and that all important behavior of g ′′ is
seen in the graph above, what degree polynomial do you think g(x) is? Why?
⊳
As we will see in more detail in the following section, derivatives also help us to
understand families of functions that differ only by changing one or more parameters.
For instance, we might be interested in understanding the behavior of all functions of the
form f (x) = a(x − h) 2 + k where a, h, and k are numbers that may vary. In the following
activity, we investigate a particular example where the value of a single parameter has
considerable impact on how the graph appears.
Activity 3.3.
Consider the family of functions given by h(x) = x 2 + cos(k x), where k is an arbitrary
positive real number.
(a) Use a graphing utility to sketch the graph of h for several different k-values,
including k = 1, 3, 5, 10. Plot h(x) = x 2 + cos(3x) on the axes provided below.
3.1. USING DERIVATIVES TO IDENTIFY EXTREME VALUES
f is increasing or decreasing, while the sign of the second derivative f ′′ tells us how the
function f is increasing or decreasing.
Activity 3.2.
Suppose that g is a function whose second derivative, g ′′ , is given by the following
graph.
1
2
1
2
g ′′
Figure 3.9: The graph of y = g ′′ (x).
(a) Find all points of inflection of g.
(b) Fully describe the concavity of g by making an appropriate sign chart.
(c) Suppose you are given that g ′ (−1.67857351) = 0. Is there is a local maximum,
local minimum, or neither (for the function g) at this critical point of g, or is it
impossible to say? Why?
(d) Assuming that g ′′ (x) is a polynomial (and that all important behavior of g ′′ is
seen in the graph above, what degree polynomial do you think g(x) is? Why?
⊳
As we will see in more detail in the following section, derivatives also help us to
understand families of functions that differ only by changing one or more parameters.
For instance, we might be interested in understanding the behavior of all functions of the
form f (x) = a(x − h) 2 + k where a, h, and k are numbers that may vary. In the following
activity, we investigate a particular example where the value of a single parameter has
considerable impact on how the graph appears.
Activity 3.3.
Consider the family of functions given by h(x) = x 2 + cos(k x), where k is an arbitrary
positive real number.
(a) Use a graphing utility to sketch the graph of h for several different k-values,
including k = 1, 3, 5, 10. Plot h(x) = x 2 + cos(3x) on the axes provided below.