

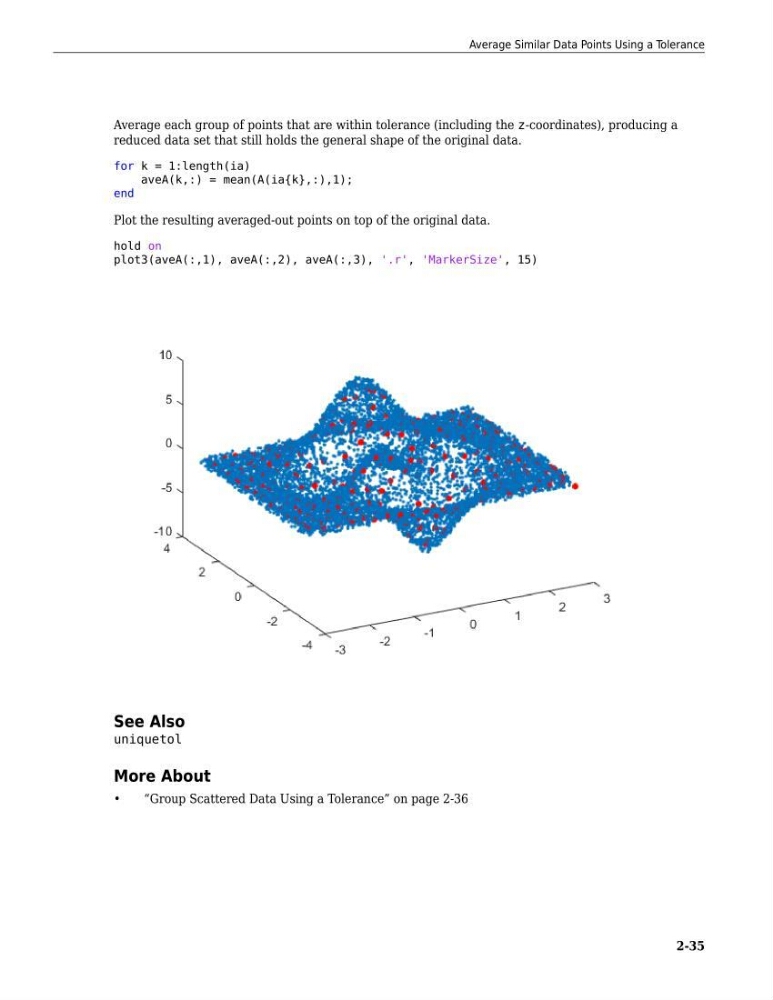
Average each group of points that are within tolerance (including the z-coordinates), producing a
reduced data set that still holds the general shape of the original data.
for k = 1:length(ia)
aveA(k,:) = mean(A(ia{k},:),1);
end
Plot the resulting averaged-out points on top of the original data.
hold on
plot3(aveA(:,1), aveA(:,2), aveA(:,3), '.r', 'MarkerSize', 15)
See Also
uniquetol
More About
•
“Group Scattered Data Using a Tolerance” on page 2-36
Average Similar Data Points Using a Tolerance
2-35
reduced data set that still holds the general shape of the original data.
for k = 1:length(ia)
aveA(k,:) = mean(A(ia{k},:),1);
end
Plot the resulting averaged-out points on top of the original data.
hold on
plot3(aveA(:,1), aveA(:,2), aveA(:,3), '.r', 'MarkerSize', 15)
See Also
uniquetol
More About
•
“Group Scattered Data Using a Tolerance” on page 2-36
Average Similar Data Points Using a Tolerance
2-35