

Group Scattered Data Using a Tolerance
This example shows how to group scattered data points based on their proximity to points of interest.
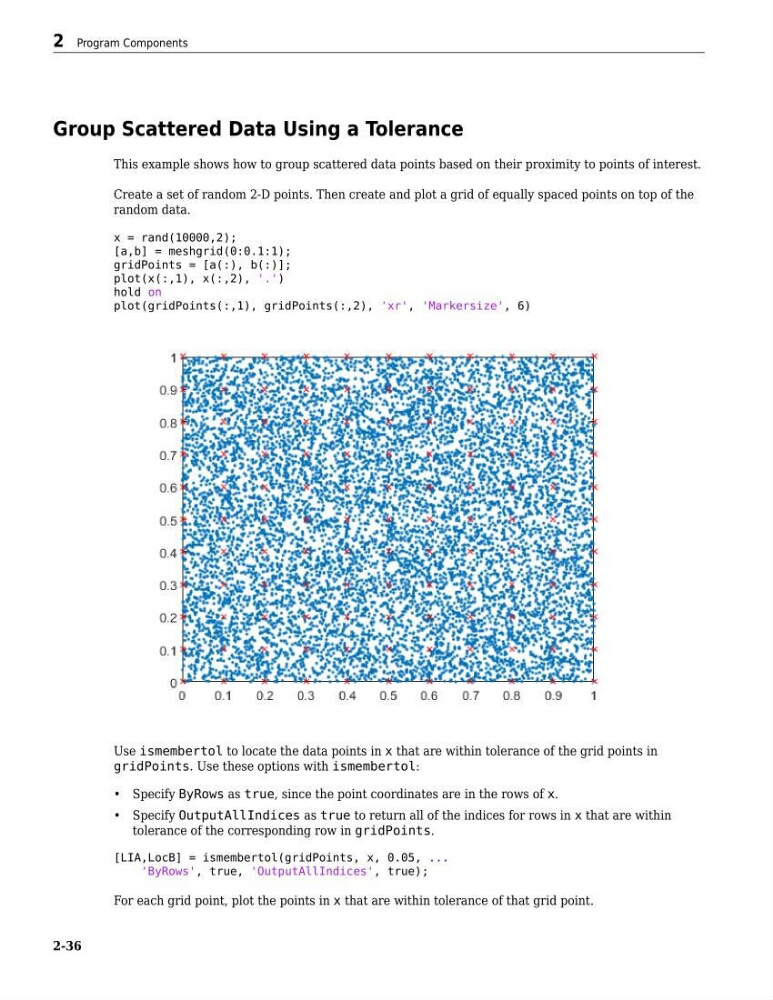
Create a set of random 2-D points. Then create and plot a grid of equally spaced points on top of the
random data.
x = rand(10000,2);
[a,b] = meshgrid(0:0.1:1);
gridPoints = [a(:), b(:)];
plot(x(:,1), x(:,2), '.')
hold on
plot(gridPoints(:,1), gridPoints(:,2), 'xr', 'Markersize', 6)
Use ismembertol to locate the data points in x that are within tolerance of the grid points in
gridPoints. Use these options with ismembertol:
• Specify ByRows as true, since the point coordinates are in the rows of x.
• Specify OutputAllIndices as true to return all of the indices for rows in x that are within
tolerance of the corresponding row in gridPoints.
[LIA,LocB] = ismembertol(gridPoints, x, 0.05, ...
'ByRows', true, 'OutputAllIndices', true);
For each grid point, plot the points in x that are within tolerance of that grid point.
2 Program Components
2-36
This example shows how to group scattered data points based on their proximity to points of interest.
Create a set of random 2-D points. Then create and plot a grid of equally spaced points on top of the
random data.
x = rand(10000,2);
[a,b] = meshgrid(0:0.1:1);
gridPoints = [a(:), b(:)];
plot(x(:,1), x(:,2), '.')
hold on
plot(gridPoints(:,1), gridPoints(:,2), 'xr', 'Markersize', 6)
Use ismembertol to locate the data points in x that are within tolerance of the grid points in
gridPoints. Use these options with ismembertol:
• Specify ByRows as true, since the point coordinates are in the rows of x.
• Specify OutputAllIndices as true to return all of the indices for rows in x that are within
tolerance of the corresponding row in gridPoints.
[LIA,LocB] = ismembertol(gridPoints, x, 0.05, ...
'ByRows', true, 'OutputAllIndices', true);
For each grid point, plot the points in x that are within tolerance of that grid point.
2 Program Components
2-36