

Average Similar Data Points Using a Tolerance
This example shows how to use uniquetol to find the average z-coordinate of 3-D points that have
similar (within tolerance) x and y coordinates.
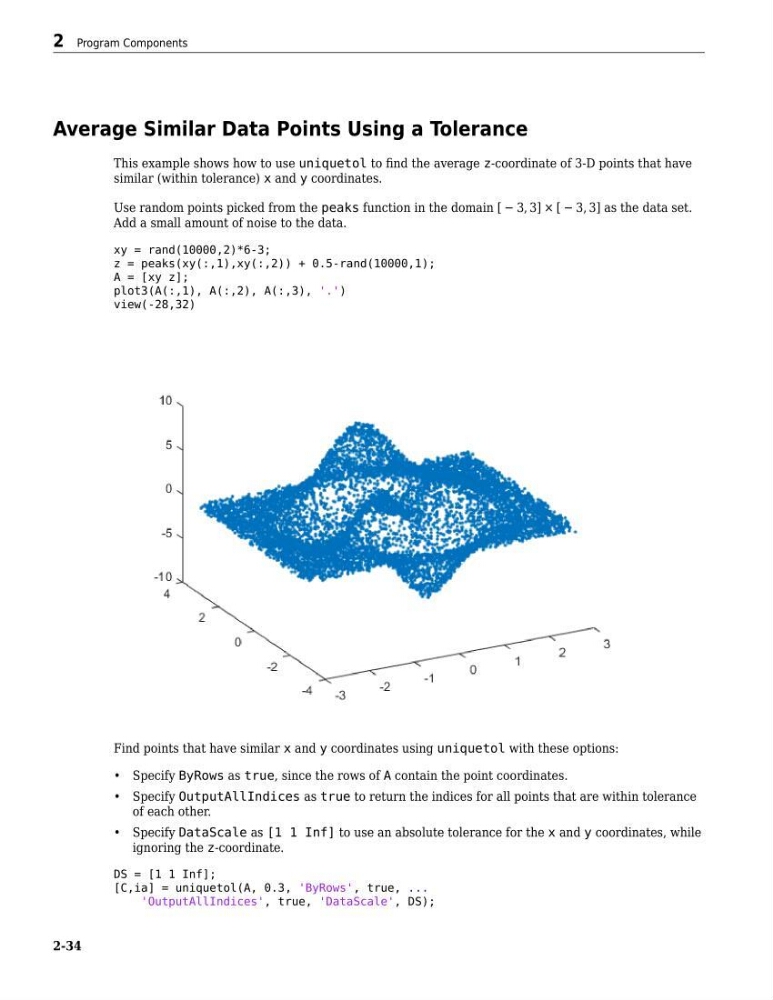
Use random points picked from the peaks function in the domain [ − 3, 3] × [ − 3, 3] as the data set.
Add a small amount of noise to the data.
xy = rand(10000,2)*6-3;
z = peaks(xy(:,1),xy(:,2)) + 0.5-rand(10000,1);
A = [xy z];
plot3(A(:,1), A(:,2), A(:,3), '.')
view(-28,32)
Find points that have similar x and y coordinates using uniquetol with these options:
• Specify ByRows as true, since the rows of A contain the point coordinates.
• Specify OutputAllIndices as true to return the indices for all points that are within tolerance
of each other.
• Specify DataScale as [1 1 Inf] to use an absolute tolerance for the x and y coordinates, while
ignoring the z-coordinate.
DS = [1 1 Inf];
[C,ia] = uniquetol(A, 0.3, 'ByRows', true, ...
'OutputAllIndices', true, 'DataScale', DS);
2 Program Components
2-34
This example shows how to use uniquetol to find the average z-coordinate of 3-D points that have
similar (within tolerance) x and y coordinates.
Use random points picked from the peaks function in the domain [ − 3, 3] × [ − 3, 3] as the data set.
Add a small amount of noise to the data.
xy = rand(10000,2)*6-3;
z = peaks(xy(:,1),xy(:,2)) + 0.5-rand(10000,1);
A = [xy z];
plot3(A(:,1), A(:,2), A(:,3), '.')
view(-28,32)
Find points that have similar x and y coordinates using uniquetol with these options:
• Specify ByRows as true, since the rows of A contain the point coordinates.
• Specify OutputAllIndices as true to return the indices for all points that are within tolerance
of each other.
• Specify DataScale as [1 1 Inf] to use an absolute tolerance for the x and y coordinates, while
ignoring the z-coordinate.
DS = [1 1 Inf];
[C,ia] = uniquetol(A, 0.3, 'ByRows', true, ...
'OutputAllIndices', true, 'DataScale', DS);
2 Program Components
2-34