

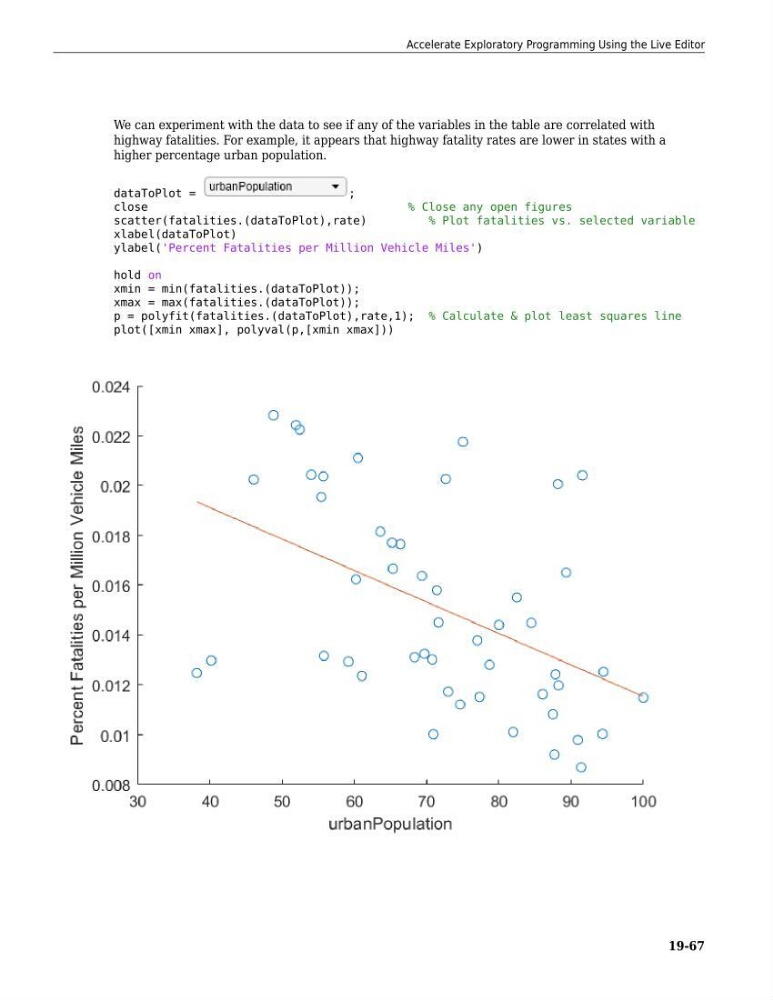
We can experiment with the data to see if any of the variables in the table are correlated with
highway fatalities. For example, it appears that highway fatality rates are lower in states with a
higher percentage urban population.
dataToPlot =
;
close
% Close any open figures
scatter(fatalities.(dataToPlot),rate)
% Plot fatalities vs. selected variable
xlabel(dataToPlot)
ylabel('Percent Fatalities per Million Vehicle Miles')
hold on
xmin = min(fatalities.(dataToPlot));
xmax = max(fatalities.(dataToPlot));
p = polyfit(fatalities.(dataToPlot),rate,1); % Calculate & plot least squares line
plot([xmin xmax], polyval(p,[xmin xmax]))
Accelerate Exploratory Programming Using the Live Editor
19-67