

Plot Fatalities and Urbanization on a US Map
Summarize your results and share your live script with your colleagues. Using your live script, they
can recreate and extend your analysis. You can also save your analysis as HTML, Microsoft® Word, or
PDF documents for publication.
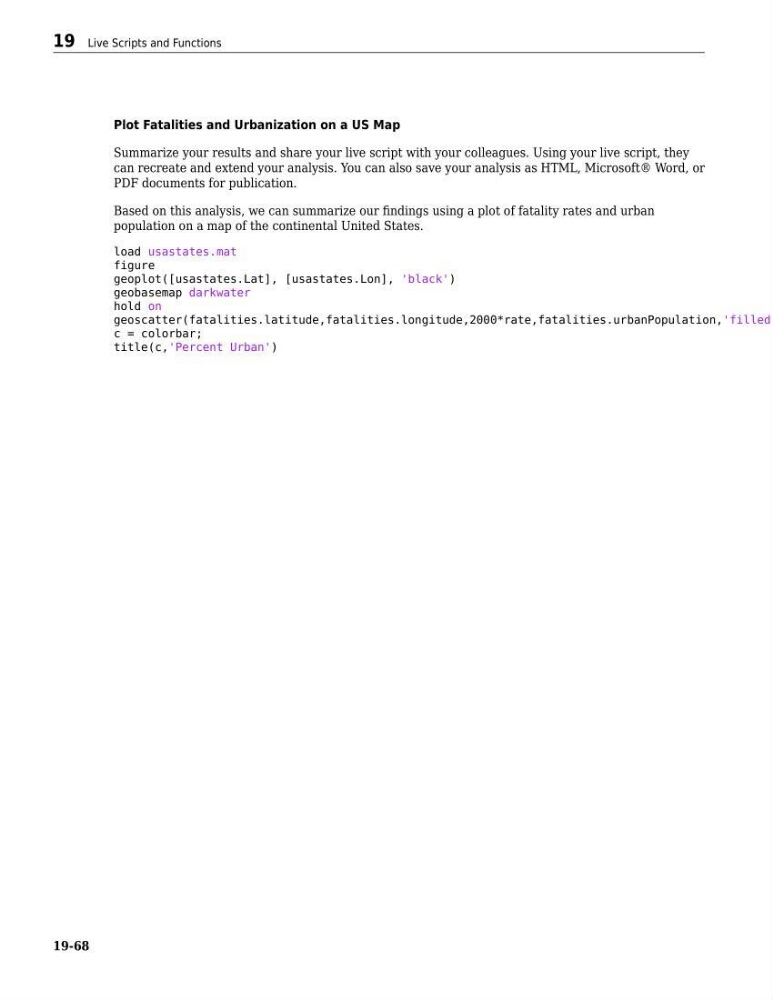
Based on this analysis, we can summarize our findings using a plot of fatality rates and urban
population on a map of the continental United States.
load usastates.mat
figure
geoplot([usastates.Lat], [usastates.Lon], 'black')
geobasemap darkwater
hold on
geoscatter(fatalities.latitude,fatalities.longitude,2000*rate,fatalities.urbanPopulation,'filled'
c = colorbar;
title(c,'Percent Urban')
19 Live Scripts and Functions
19-68