

disp([states{maxIdx} ' has the highest fatality rate at ' num2str(rate(maxIdx))])
Mississippi has the highest fatality rate at 0.022825
Distribution of Fatalities
You can include visualizations in your program. Like output, plots and figures appear together with
the code that produced them.
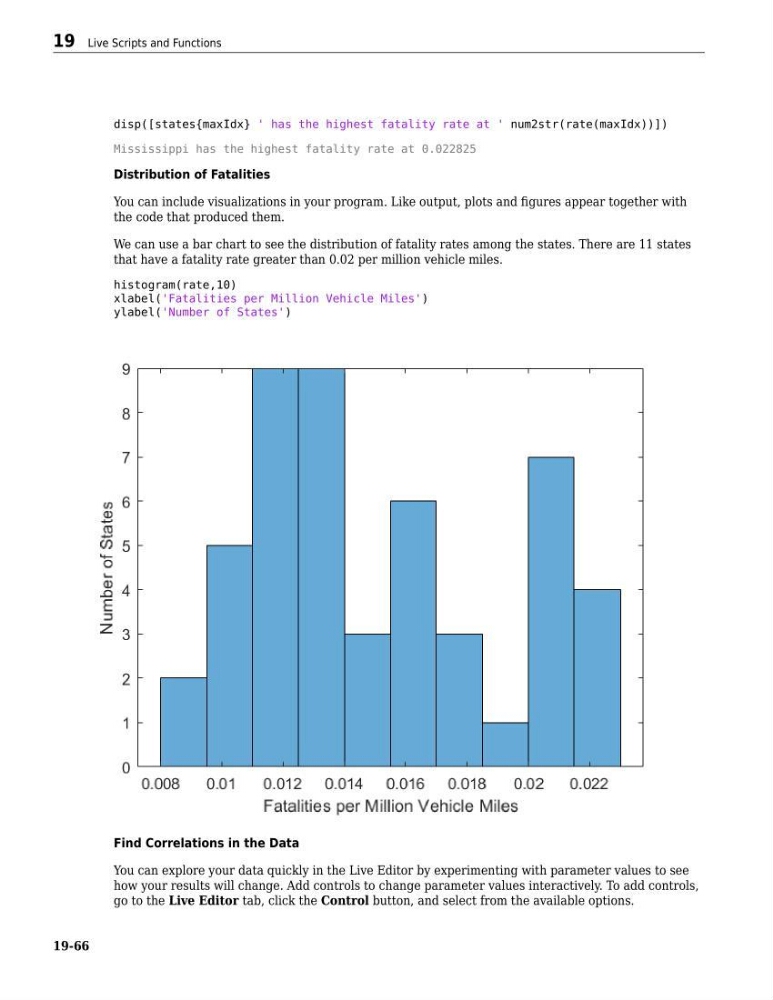
We can use a bar chart to see the distribution of fatality rates among the states. There are 11 states
that have a fatality rate greater than 0.02 per million vehicle miles.
histogram(rate,10)
xlabel('Fatalities per Million Vehicle Miles')
ylabel('Number of States')
Find Correlations in the Data
You can explore your data quickly in the Live Editor by experimenting with parameter values to see
how your results will change. Add controls to change parameter values interactively. To add controls,
go to the Live Editor tab, click the Control button, and select from the available options.
19 Live Scripts and Functions
19-66