

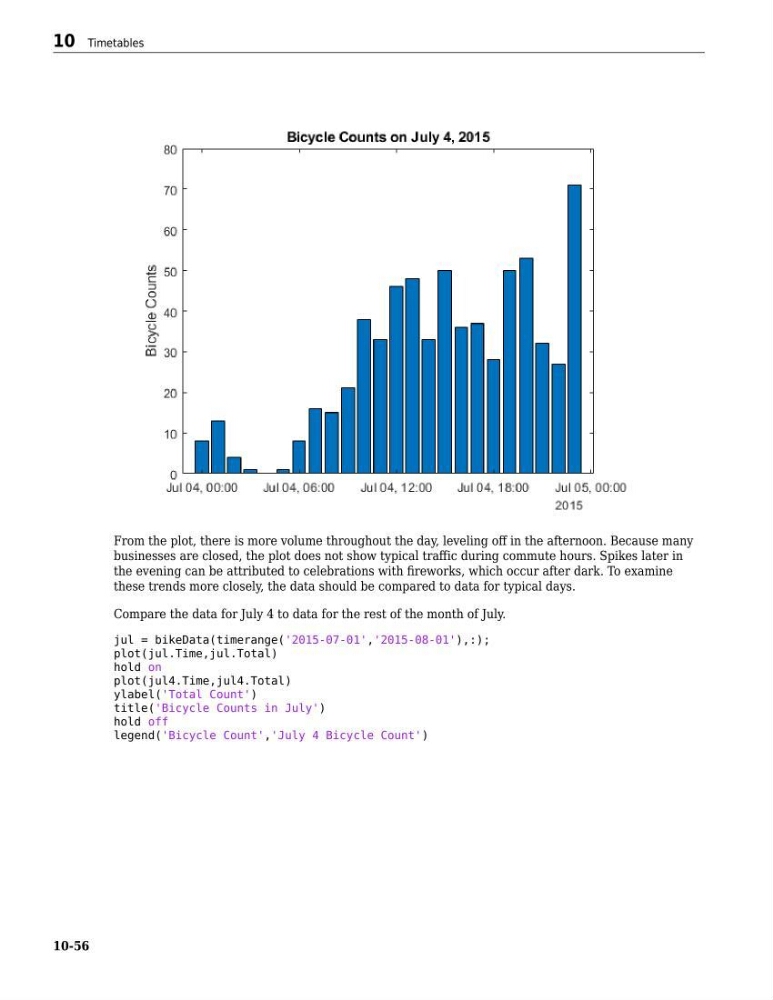
From the plot, there is more volume throughout the day, leveling off in the afternoon. Because many
businesses are closed, the plot does not show typical traffic during commute hours. Spikes later in
the evening can be attributed to celebrations with fireworks, which occur after dark. To examine
these trends more closely, the data should be compared to data for typical days.
Compare the data for July 4 to data for the rest of the month of July.
jul = bikeData(timerange('2015-07-01','2015-08-01'),:);
plot(jul.Time,jul.Total)
hold on
plot(jul4.Time,jul4.Total)
ylabel('Total Count')
title('Bicycle Counts in July')
hold off
legend('Bicycle Count','July 4 Bicycle Count')
10 Timetables
10-56
businesses are closed, the plot does not show typical traffic during commute hours. Spikes later in
the evening can be attributed to celebrations with fireworks, which occur after dark. To examine
these trends more closely, the data should be compared to data for typical days.
Compare the data for July 4 to data for the rest of the month of July.
jul = bikeData(timerange('2015-07-01','2015-08-01'),:);
plot(jul.Time,jul.Total)
hold on
plot(jul4.Time,jul4.Total)
ylabel('Total Count')
title('Bicycle Counts in July')
hold off
legend('Bicycle Count','July 4 Bicycle Count')
10 Timetables
10-56