

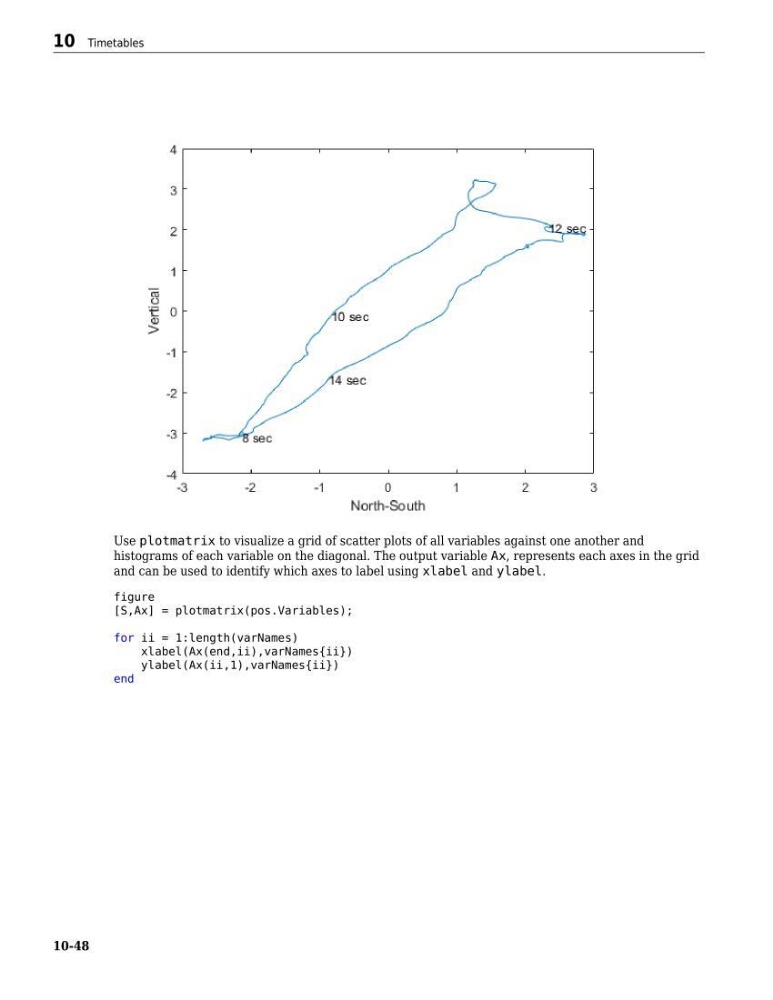
Use plotmatrix to visualize a grid of scatter plots of all variables against one another and
histograms of each variable on the diagonal. The output variable Ax, represents each axes in the grid
and can be used to identify which axes to label using xlabel and ylabel.
figure
[S,Ax] = plotmatrix(pos.Variables);
for ii = 1:length(varNames)
xlabel(Ax(end,ii),varNames{ii})
ylabel(Ax(ii,1),varNames{ii})
end
10 Timetables
10-48
histograms of each variable on the diagonal. The output variable Ax, represents each axes in the grid
and can be used to identify which axes to label using xlabel and ylabel.
figure
[S,Ax] = plotmatrix(pos.Variables);
for ii = 1:length(varNames)
xlabel(Ax(end,ii),varNames{ii})
ylabel(Ax(ii,1),varNames{ii})
end
10 Timetables
10-48