

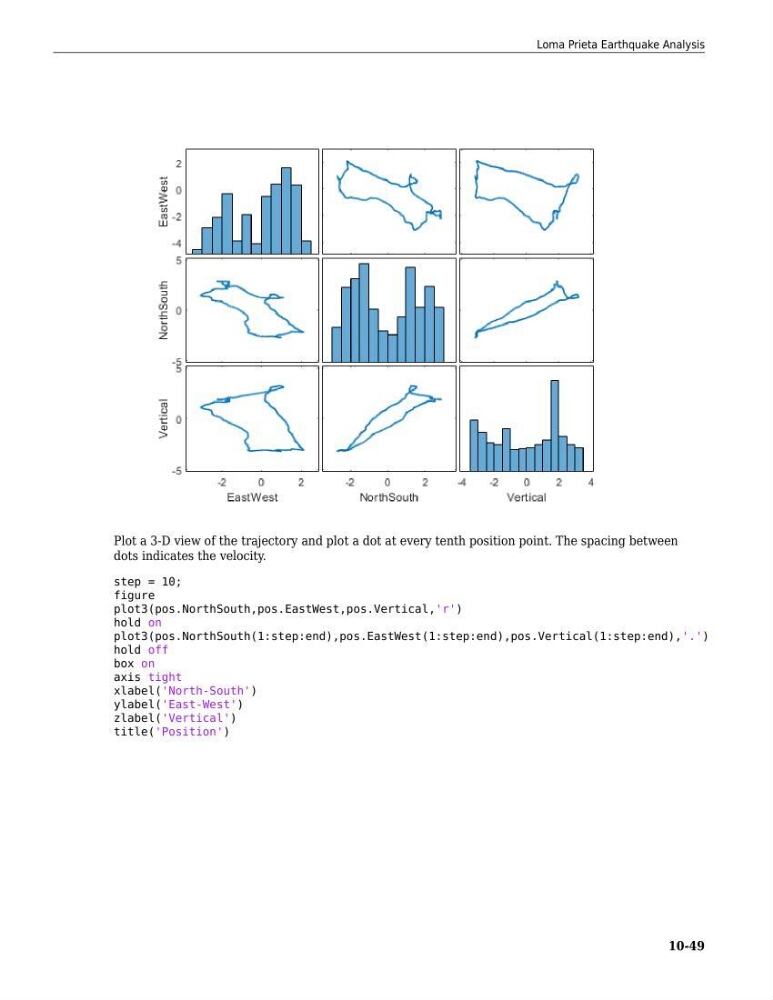
Plot a 3-D view of the trajectory and plot a dot at every tenth position point. The spacing between
dots indicates the velocity.
step = 10;
figure
plot3(pos.NorthSouth,pos.EastWest,pos.Vertical,'r')
hold on
plot3(pos.NorthSouth(1:step:end),pos.EastWest(1:step:end),pos.Vertical(1:step:end),'.')
hold off
box on
axis tight
xlabel('North-South')
ylabel('East-West')
zlabel('Vertical')
title('Position')
Loma Prieta Earthquake Analysis
10-49
dots indicates the velocity.
step = 10;
figure
plot3(pos.NorthSouth,pos.EastWest,pos.Vertical,'r')
hold on
plot3(pos.NorthSouth(1:step:end),pos.EastWest(1:step:end),pos.Vertical(1:step:end),'.')
hold off
box on
axis tight
xlabel('North-South')
ylabel('East-West')
zlabel('Vertical')
title('Position')
Loma Prieta Earthquake Analysis
10-49