

Visualize Trajectories
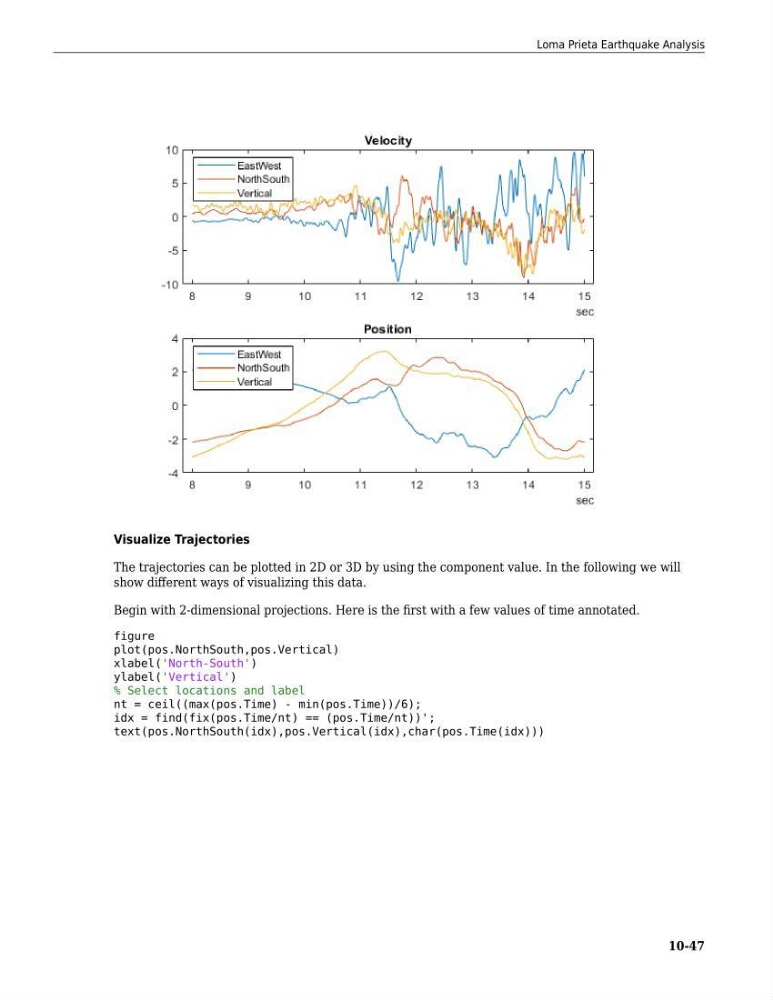
The trajectories can be plotted in 2D or 3D by using the component value. In the following we will
show different ways of visualizing this data.
Begin with 2-dimensional projections. Here is the first with a few values of time annotated.
figure
plot(pos.NorthSouth,pos.Vertical)
xlabel('North-South')
ylabel('Vertical')
% Select locations and label
nt = ceil((max(pos.Time) - min(pos.Time))/6);
idx = find(fix(pos.Time/nt) == (pos.Time/nt))';
text(pos.NorthSouth(idx),pos.Vertical(idx),char(pos.Time(idx)))
Loma Prieta Earthquake Analysis
10-47
The trajectories can be plotted in 2D or 3D by using the component value. In the following we will
show different ways of visualizing this data.
Begin with 2-dimensional projections. Here is the first with a few values of time annotated.
figure
plot(pos.NorthSouth,pos.Vertical)
xlabel('North-South')
ylabel('Vertical')
% Select locations and label
nt = ceil((max(pos.Time) - min(pos.Time))/6);
idx = find(fix(pos.Time/nt) == (pos.Time/nt))';
text(pos.NorthSouth(idx),pos.Vertical(idx),char(pos.Time(idx)))
Loma Prieta Earthquake Analysis
10-47