

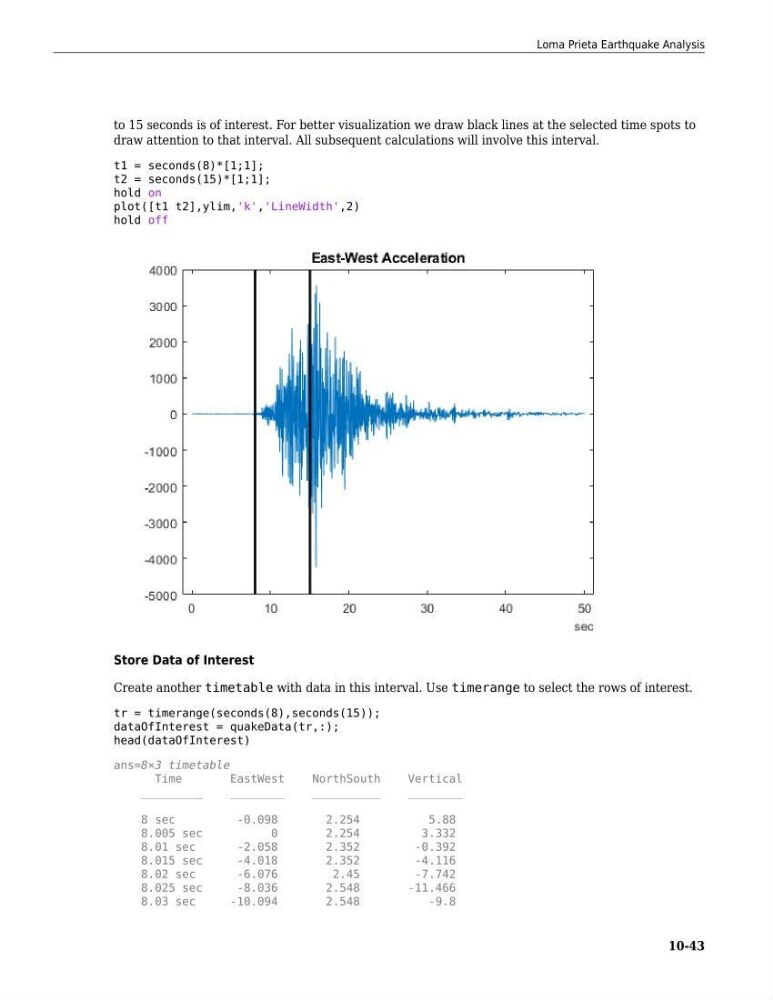
to 15 seconds is of interest. For better visualization we draw black lines at the selected time spots to
draw attention to that interval. All subsequent calculations will involve this interval.
t1 = seconds(8)*[1;1];
t2 = seconds(15)*[1;1];
hold on
plot([t1 t2],ylim,'k','LineWidth',2)
hold off
Store Data of Interest
Create another timetable with data in this interval. Use timerange to select the rows of interest.
tr = timerange(seconds(8),seconds(15));
dataOfInterest = quakeData(tr,:);
head(dataOfInterest)
ans=8×3 timetable
Time
EastWest
NorthSouth
Vertical
_________
________
__________
________
8 sec
-0.098
2.254
5.88
8.005 sec
0
2.254
3.332
8.01 sec
-2.058
2.352
-0.392
8.015 sec
-4.018
2.352
-4.116
8.02 sec
-6.076
2.45
-7.742
8.025 sec
-8.036
2.548
-11.466
8.03 sec
-10.094
2.548
-9.8
Loma Prieta Earthquake Analysis
10-43
draw attention to that interval. All subsequent calculations will involve this interval.
t1 = seconds(8)*[1;1];
t2 = seconds(15)*[1;1];
hold on
plot([t1 t2],ylim,'k','LineWidth',2)
hold off
Store Data of Interest
Create another timetable with data in this interval. Use timerange to select the rows of interest.
tr = timerange(seconds(8),seconds(15));
dataOfInterest = quakeData(tr,:);
head(dataOfInterest)
ans=8×3 timetable
Time
EastWest
NorthSouth
Vertical
_________
________
__________
________
8 sec
-0.098
2.254
5.88
8.005 sec
0
2.254
3.332
8.01 sec
-2.058
2.352
-0.392
8.015 sec
-4.018
2.352
-4.116
8.02 sec
-6.076
2.45
-7.742
8.025 sec
-8.036
2.548
-11.466
8.03 sec
-10.094
2.548
-9.8
Loma Prieta Earthquake Analysis
10-43