

0.02 sec
5
2
0
0.025 sec
5
2
0
0.03 sec
5
2
0
0.035 sec
5
1
0
0.04 sec
5
1
0
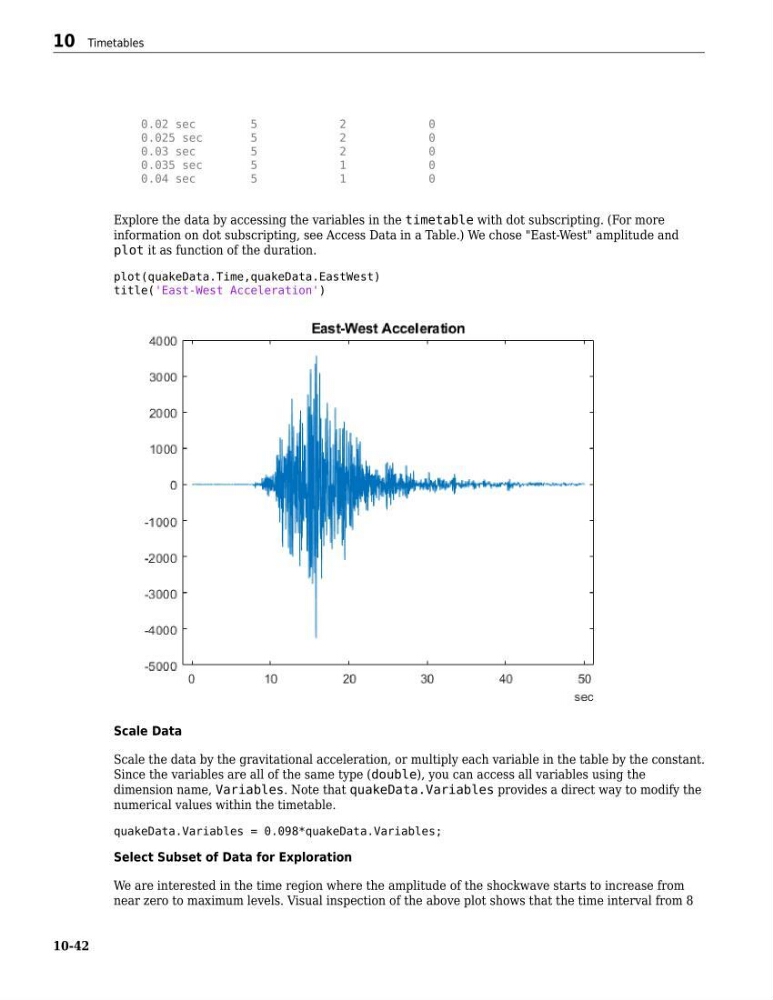
Explore the data by accessing the variables in the timetable with dot subscripting. (For more
information on dot subscripting, see Access Data in a Table.) We chose "East-West" amplitude and
plot it as function of the duration.
plot(quakeData.Time,quakeData.EastWest)
title('East-West Acceleration')
Scale Data
Scale the data by the gravitational acceleration, or multiply each variable in the table by the constant.
Since the variables are all of the same type (double), you can access all variables using the
dimension name, Variables. Note that quakeData.Variables provides a direct way to modify the
numerical values within the timetable.
quakeData.Variables = 0.098*quakeData.Variables;
Select Subset of Data for Exploration
We are interested in the time region where the amplitude of the shockwave starts to increase from
near zero to maximum levels. Visual inspection of the above plot shows that the time interval from 8
10 Timetables
10-42
5
2
0
0.025 sec
5
2
0
0.03 sec
5
2
0
0.035 sec
5
1
0
0.04 sec
5
1
0
Explore the data by accessing the variables in the timetable with dot subscripting. (For more
information on dot subscripting, see Access Data in a Table.) We chose "East-West" amplitude and
plot it as function of the duration.
plot(quakeData.Time,quakeData.EastWest)
title('East-West Acceleration')
Scale Data
Scale the data by the gravitational acceleration, or multiply each variable in the table by the constant.
Since the variables are all of the same type (double), you can access all variables using the
dimension name, Variables. Note that quakeData.Variables provides a direct way to modify the
numerical values within the timetable.
quakeData.Variables = 0.098*quakeData.Variables;
Select Subset of Data for Exploration
We are interested in the time region where the amplitude of the shockwave starts to increase from
near zero to maximum levels. Visual inspection of the above plot shows that the time interval from 8
10 Timetables
10-42