

8.035 sec
-8.232
2.646
-8.134
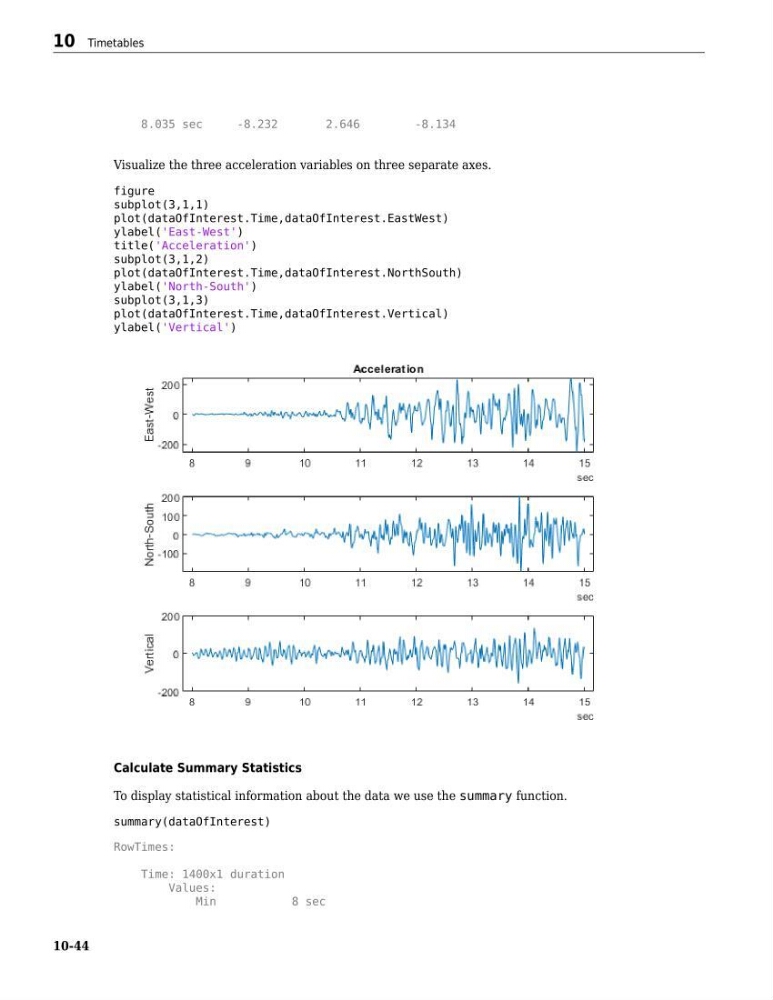
Visualize the three acceleration variables on three separate axes.
figure
subplot(3,1,1)
plot(dataOfInterest.Time,dataOfInterest.EastWest)
ylabel('East-West')
title('Acceleration')
subplot(3,1,2)
plot(dataOfInterest.Time,dataOfInterest.NorthSouth)
ylabel('North-South')
subplot(3,1,3)
plot(dataOfInterest.Time,dataOfInterest.Vertical)
ylabel('Vertical')
Calculate Summary Statistics
To display statistical information about the data we use the summary function.
summary(dataOfInterest)
RowTimes:
Time: 1400x1 duration
Values:
Min
8 sec
10 Timetables
10-44
-8.232
2.646
-8.134
Visualize the three acceleration variables on three separate axes.
figure
subplot(3,1,1)
plot(dataOfInterest.Time,dataOfInterest.EastWest)
ylabel('East-West')
title('Acceleration')
subplot(3,1,2)
plot(dataOfInterest.Time,dataOfInterest.NorthSouth)
ylabel('North-South')
subplot(3,1,3)
plot(dataOfInterest.Time,dataOfInterest.Vertical)
ylabel('Vertical')
Calculate Summary Statistics
To display statistical information about the data we use the summary function.
summary(dataOfInterest)
RowTimes:
Time: 1400x1 duration
Values:
Min
8 sec
10 Timetables
10-44