

NorthDakota
2.7822e+05
2.4633
Ohio
2.7478e+05
2.4329
Oklahoma
2.4477e+05
2.1672
NewYork
2.3126e+05
2.0475
Wisconsin
2.3079e+05
2.0434
⋮
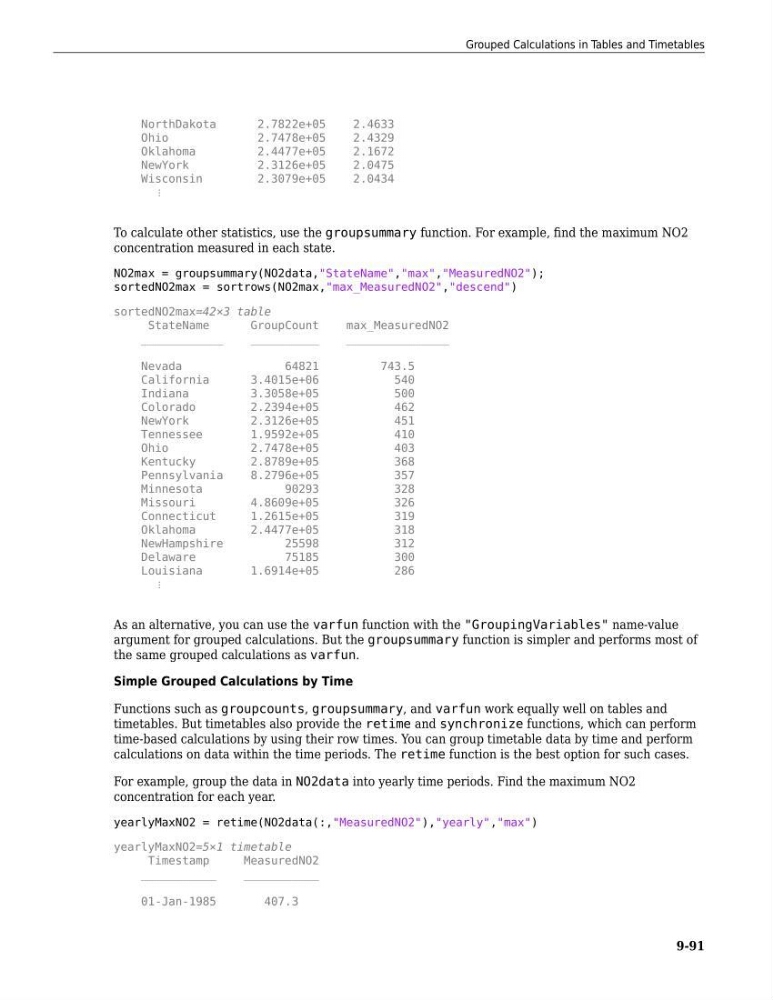
To calculate other statistics, use the groupsummary function. For example, find the maximum NO2
concentration measured in each state.
NO2max = groupsummary(NO2data,"StateName","max","MeasuredNO2");
sortedNO2max = sortrows(NO2max,"max_MeasuredNO2","descend")
sortedNO2max=42×3 table
StateName
GroupCount
max_MeasuredNO2
____________
__________
_______________
Nevada
64821
743.5
California
3.4015e+06
540
Indiana
3.3058e+05
500
Colorado
2.2394e+05
462
NewYork
2.3126e+05
451
Tennessee
1.9592e+05
410
Ohio
2.7478e+05
403
Kentucky
2.8789e+05
368
Pennsylvania
8.2796e+05
357
Minnesota
90293
328
Missouri
4.8609e+05
326
Connecticut
1.2615e+05
319
Oklahoma
2.4477e+05
318
NewHampshire
25598
312
Delaware
75185
300
Louisiana
1.6914e+05
286
⋮
As an alternative, you can use the varfun function with the "GroupingVariables" name-value
argument for grouped calculations. But the groupsummary function is simpler and performs most of
the same grouped calculations as varfun.
Simple Grouped Calculations by Time
Functions such as groupcounts, groupsummary, and varfun work equally well on tables and
timetables. But timetables also provide the retime and synchronize functions, which can perform
time-based calculations by using their row times. You can group timetable data by time and perform
calculations on data within the time periods. The retime function is the best option for such cases.
For example, group the data in NO2data into yearly time periods. Find the maximum NO2
concentration for each year.
yearlyMaxNO2 = retime(NO2data(:,"MeasuredNO2"),"yearly","max")
yearlyMaxNO2=5×1 timetable
Timestamp
MeasuredNO2
___________
___________
01-Jan-1985
407.3
Grouped Calculations in Tables and Timetables
9-91
2.7822e+05
2.4633
Ohio
2.7478e+05
2.4329
Oklahoma
2.4477e+05
2.1672
NewYork
2.3126e+05
2.0475
Wisconsin
2.3079e+05
2.0434
⋮
To calculate other statistics, use the groupsummary function. For example, find the maximum NO2
concentration measured in each state.
NO2max = groupsummary(NO2data,"StateName","max","MeasuredNO2");
sortedNO2max = sortrows(NO2max,"max_MeasuredNO2","descend")
sortedNO2max=42×3 table
StateName
GroupCount
max_MeasuredNO2
____________
__________
_______________
Nevada
64821
743.5
California
3.4015e+06
540
Indiana
3.3058e+05
500
Colorado
2.2394e+05
462
NewYork
2.3126e+05
451
Tennessee
1.9592e+05
410
Ohio
2.7478e+05
403
Kentucky
2.8789e+05
368
Pennsylvania
8.2796e+05
357
Minnesota
90293
328
Missouri
4.8609e+05
326
Connecticut
1.2615e+05
319
Oklahoma
2.4477e+05
318
NewHampshire
25598
312
Delaware
75185
300
Louisiana
1.6914e+05
286
⋮
As an alternative, you can use the varfun function with the "GroupingVariables" name-value
argument for grouped calculations. But the groupsummary function is simpler and performs most of
the same grouped calculations as varfun.
Simple Grouped Calculations by Time
Functions such as groupcounts, groupsummary, and varfun work equally well on tables and
timetables. But timetables also provide the retime and synchronize functions, which can perform
time-based calculations by using their row times. You can group timetable data by time and perform
calculations on data within the time periods. The retime function is the best option for such cases.
For example, group the data in NO2data into yearly time periods. Find the maximum NO2
concentration for each year.
yearlyMaxNO2 = retime(NO2data(:,"MeasuredNO2"),"yearly","max")
yearlyMaxNO2=5×1 timetable
Timestamp
MeasuredNO2
___________
___________
01-Jan-1985
407.3
Grouped Calculations in Tables and Timetables
9-91