

numAlaska = sum(NO2data.StateName=="Alaska")
numAlaska = 7071
numArizona = sum(NO2data.StateName=="Arizona")
numArizona = 142793
It is tedious to perform this calculation multiple times or to store intermediate results in many
variables or subtables. Instead, MATLAB provides functions that group data in tables and apply
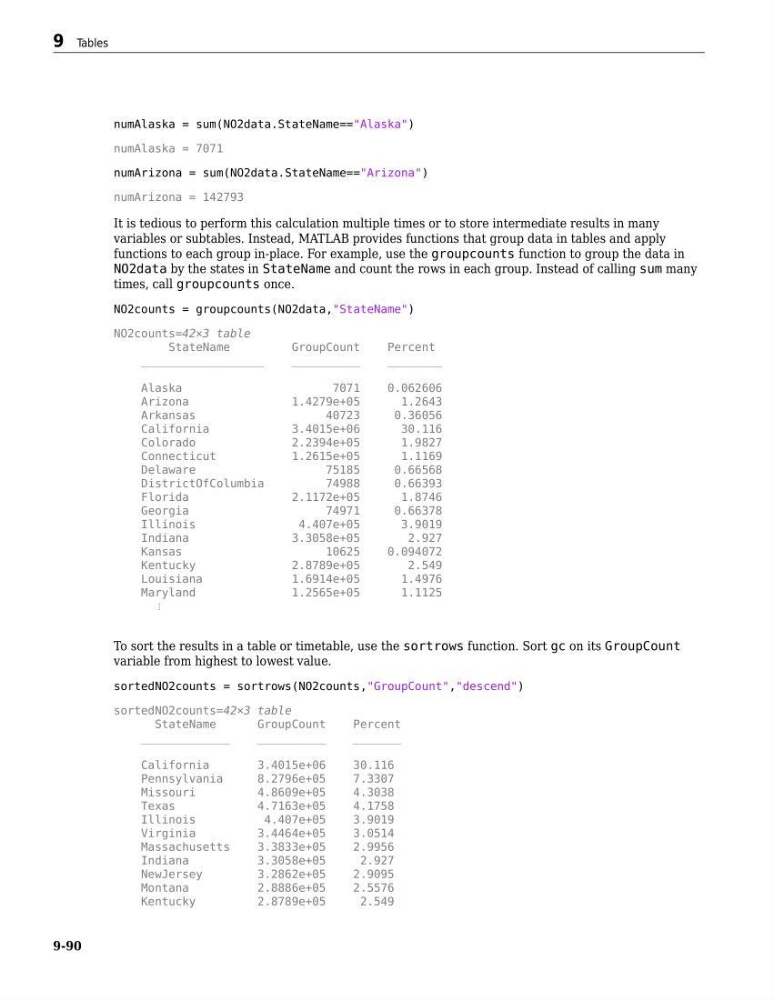
functions to each group in-place. For example, use the groupcounts function to group the data in
NO2data by the states in StateName and count the rows in each group. Instead of calling sum many
times, call groupcounts once.
NO2counts = groupcounts(NO2data,"StateName")
NO2counts=42×3 table
StateName
GroupCount
Percent
__________________
__________
________
Alaska
7071
0.062606
Arizona
1.4279e+05
1.2643
Arkansas
40723
0.36056
California
3.4015e+06
30.116
Colorado
2.2394e+05
1.9827
Connecticut
1.2615e+05
1.1169
Delaware
75185
0.66568
DistrictOfColumbia
74988
0.66393
Florida
2.1172e+05
1.8746
Georgia
74971
0.66378
Illinois
4.407e+05
3.9019
Indiana
3.3058e+05
2.927
Kansas
10625
0.094072
Kentucky
2.8789e+05
2.549
Louisiana
1.6914e+05
1.4976
Maryland
1.2565e+05
1.1125
⋮
To sort the results in a table or timetable, use the sortrows function. Sort gc on its GroupCount
variable from highest to lowest value.
sortedNO2counts = sortrows(NO2counts,"GroupCount","descend")
sortedNO2counts=42×3 table
StateName
GroupCount
Percent
_____________
__________
_______
California
3.4015e+06
30.116
Pennsylvania
8.2796e+05
7.3307
Missouri
4.8609e+05
4.3038
Texas
4.7163e+05
4.1758
Illinois
4.407e+05
3.9019
Virginia
3.4464e+05
3.0514
Massachusetts
3.3833e+05
2.9956
Indiana
3.3058e+05
2.927
NewJersey
3.2862e+05
2.9095
Montana
2.8886e+05
2.5576
Kentucky
2.8789e+05
2.549
9 Tables
9-90
numAlaska = 7071
numArizona = sum(NO2data.StateName=="Arizona")
numArizona = 142793
It is tedious to perform this calculation multiple times or to store intermediate results in many
variables or subtables. Instead, MATLAB provides functions that group data in tables and apply
functions to each group in-place. For example, use the groupcounts function to group the data in
NO2data by the states in StateName and count the rows in each group. Instead of calling sum many
times, call groupcounts once.
NO2counts = groupcounts(NO2data,"StateName")
NO2counts=42×3 table
StateName
GroupCount
Percent
__________________
__________
________
Alaska
7071
0.062606
Arizona
1.4279e+05
1.2643
Arkansas
40723
0.36056
California
3.4015e+06
30.116
Colorado
2.2394e+05
1.9827
Connecticut
1.2615e+05
1.1169
Delaware
75185
0.66568
DistrictOfColumbia
74988
0.66393
Florida
2.1172e+05
1.8746
Georgia
74971
0.66378
Illinois
4.407e+05
3.9019
Indiana
3.3058e+05
2.927
Kansas
10625
0.094072
Kentucky
2.8789e+05
2.549
Louisiana
1.6914e+05
1.4976
Maryland
1.2565e+05
1.1125
⋮
To sort the results in a table or timetable, use the sortrows function. Sort gc on its GroupCount
variable from highest to lowest value.
sortedNO2counts = sortrows(NO2counts,"GroupCount","descend")
sortedNO2counts=42×3 table
StateName
GroupCount
Percent
_____________
__________
_______
California
3.4015e+06
30.116
Pennsylvania
8.2796e+05
7.3307
Missouri
4.8609e+05
4.3038
Texas
4.7163e+05
4.1758
Illinois
4.407e+05
3.9019
Virginia
3.4464e+05
3.0514
Massachusetts
3.3833e+05
2.9956
Indiana
3.3058e+05
2.927
NewJersey
3.2862e+05
2.9095
Montana
2.8886e+05
2.5576
Kentucky
2.8789e+05
2.549
9 Tables
9-90