

Combine the local date and time into a single timestamp. The new Timestamp table variable is a
datetime array. Delete the DateLocal and TimeLocal variables because they are now redundant.
NO2data.Timestamp = NO2data.DateLocal + NO2data.TimeLocal;
NO2data.Timestamp.Format = "default";
NO2data.DateLocal = [];
NO2data.TimeLocal = [];
To categorize the data later, convert the StateName and CountyName variables to categorical
arrays, first erasing space characters from the names. There are fixed sets of state and county names
in the data, which makes it convenient to create categories based on them.
NO2data.StateName = categorical(erase(NO2data.StateName," "));
NO2data.CountyName = categorical(erase(NO2data.CountyName," "));
Rename the SampleMeasurement variable to MeasuredNO2. One way to rename table variables is
by using the VariableNames property of the table.
NO2data.Properties.VariableNames("SampleMeasurement") = "MeasuredNO2";
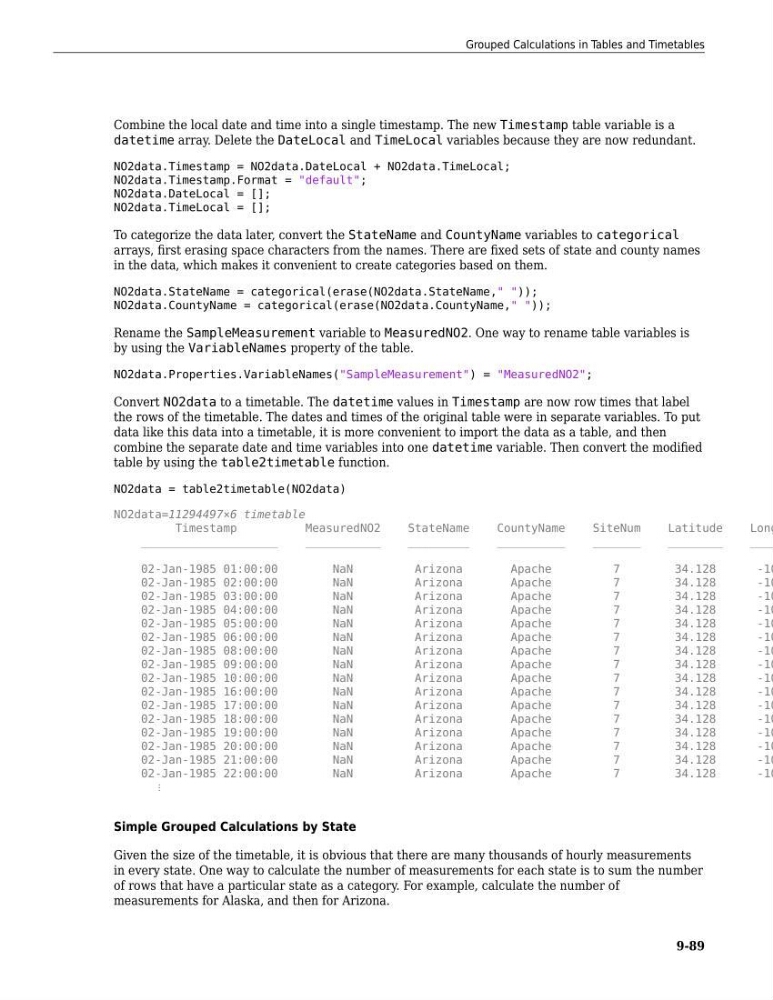
Convert NO2data to a timetable. The datetime values in Timestamp are now row times that label
the rows of the timetable. The dates and times of the original table were in separate variables. To put
data like this data into a timetable, it is more convenient to import the data as a table, and then
combine the separate date and time variables into one datetime variable. Then convert the modified
table by using the table2timetable function.
NO2data = table2timetable(NO2data)
NO2data=11294497×6 timetable
Timestamp
MeasuredNO2
StateName
CountyName
SiteNum
Latitude
Long
____________________
___________
_________
__________
_______
________
____
02-Jan-1985 01:00:00
NaN
Arizona
Apache
7
34.128
-10
02-Jan-1985 02:00:00
NaN
Arizona
Apache
7
34.128
-10
02-Jan-1985 03:00:00
NaN
Arizona
Apache
7
34.128
-10
02-Jan-1985 04:00:00
NaN
Arizona
Apache
7
34.128
-10
02-Jan-1985 05:00:00
NaN
Arizona
Apache
7
34.128
-10
02-Jan-1985 06:00:00
NaN
Arizona
Apache
7
34.128
-10
02-Jan-1985 08:00:00
NaN
Arizona
Apache
7
34.128
-10
02-Jan-1985 09:00:00
NaN
Arizona
Apache
7
34.128
-10
02-Jan-1985 10:00:00
NaN
Arizona
Apache
7
34.128
-10
02-Jan-1985 16:00:00
NaN
Arizona
Apache
7
34.128
-10
02-Jan-1985 17:00:00
NaN
Arizona
Apache
7
34.128
-10
02-Jan-1985 18:00:00
NaN
Arizona
Apache
7
34.128
-10
02-Jan-1985 19:00:00
NaN
Arizona
Apache
7
34.128
-10
02-Jan-1985 20:00:00
NaN
Arizona
Apache
7
34.128
-10
02-Jan-1985 21:00:00
NaN
Arizona
Apache
7
34.128
-10
02-Jan-1985 22:00:00
NaN
Arizona
Apache
7
34.128
-10
⋮
Simple Grouped Calculations by State
Given the size of the timetable, it is obvious that there are many thousands of hourly measurements
in every state. One way to calculate the number of measurements for each state is to sum the number
of rows that have a particular state as a category. For example, calculate the number of
measurements for Alaska, and then for Arizona.
Grouped Calculations in Tables and Timetables
9-89
datetime array. Delete the DateLocal and TimeLocal variables because they are now redundant.
NO2data.Timestamp = NO2data.DateLocal + NO2data.TimeLocal;
NO2data.Timestamp.Format = "default";
NO2data.DateLocal = [];
NO2data.TimeLocal = [];
To categorize the data later, convert the StateName and CountyName variables to categorical
arrays, first erasing space characters from the names. There are fixed sets of state and county names
in the data, which makes it convenient to create categories based on them.
NO2data.StateName = categorical(erase(NO2data.StateName," "));
NO2data.CountyName = categorical(erase(NO2data.CountyName," "));
Rename the SampleMeasurement variable to MeasuredNO2. One way to rename table variables is
by using the VariableNames property of the table.
NO2data.Properties.VariableNames("SampleMeasurement") = "MeasuredNO2";
Convert NO2data to a timetable. The datetime values in Timestamp are now row times that label
the rows of the timetable. The dates and times of the original table were in separate variables. To put
data like this data into a timetable, it is more convenient to import the data as a table, and then
combine the separate date and time variables into one datetime variable. Then convert the modified
table by using the table2timetable function.
NO2data = table2timetable(NO2data)
NO2data=11294497×6 timetable
Timestamp
MeasuredNO2
StateName
CountyName
SiteNum
Latitude
Long
____________________
___________
_________
__________
_______
________
____
02-Jan-1985 01:00:00
NaN
Arizona
Apache
7
34.128
-10
02-Jan-1985 02:00:00
NaN
Arizona
Apache
7
34.128
-10
02-Jan-1985 03:00:00
NaN
Arizona
Apache
7
34.128
-10
02-Jan-1985 04:00:00
NaN
Arizona
Apache
7
34.128
-10
02-Jan-1985 05:00:00
NaN
Arizona
Apache
7
34.128
-10
02-Jan-1985 06:00:00
NaN
Arizona
Apache
7
34.128
-10
02-Jan-1985 08:00:00
NaN
Arizona
Apache
7
34.128
-10
02-Jan-1985 09:00:00
NaN
Arizona
Apache
7
34.128
-10
02-Jan-1985 10:00:00
NaN
Arizona
Apache
7
34.128
-10
02-Jan-1985 16:00:00
NaN
Arizona
Apache
7
34.128
-10
02-Jan-1985 17:00:00
NaN
Arizona
Apache
7
34.128
-10
02-Jan-1985 18:00:00
NaN
Arizona
Apache
7
34.128
-10
02-Jan-1985 19:00:00
NaN
Arizona
Apache
7
34.128
-10
02-Jan-1985 20:00:00
NaN
Arizona
Apache
7
34.128
-10
02-Jan-1985 21:00:00
NaN
Arizona
Apache
7
34.128
-10
02-Jan-1985 22:00:00
NaN
Arizona
Apache
7
34.128
-10
⋮
Simple Grouped Calculations by State
Given the size of the timetable, it is obvious that there are many thousands of hourly measurements
in every state. One way to calculate the number of measurements for each state is to sum the number
of rows that have a particular state as a category. For example, calculate the number of
measurements for Alaska, and then for Arizona.
Grouped Calculations in Tables and Timetables
9-89