

01-Jan-1986
500
01-Jan-1987
497
01-Jan-1988
743.5
01-Jan-1989
462
This calculation is useful if you have one time series. In this case, the data in the MeasuredNO2
variable come from multiple sites. A more useful analysis is to group by both year and site.
Calculate Annual Means by Site
The US EPA has two National Ambient Air Quality Standards (NAAQS) for NO2. A location is not in
compliance with the NAAQS if either:
• The annual mean exceeds 53 ppb
• The 98th percentile of 1-hour daily maximum concentrations, averaged over 3 years, exceeds 100
parts-per-billion (ppb)
Analyze data in NO2data to find locations that are not in compliance with the first standard, where
the annual mean exceeded 53 ppb. There are three different ways to approach this analysis. What the
three approaches have in common is that you can group the data by both time and site to calculate
annual means by site.
Group by Multiple Grouping Variables
To find sites that do not comply with the NAAQS, calculate the mean value for each site for each year.
While NO2data does not include unique identifiers for the sites, you can use state names, county
names, and site numbers together to uniquely identify air quality sites.
The row times of NO2data are datetime values. Extract their year components and add a new
variable to NO2data named Year. Calculate the annual means for each site by using groupsummary
with StateName, CountyName, SiteNum, and Year as grouping variables.
NO2data.Year = year(NO2data.Timestamp);
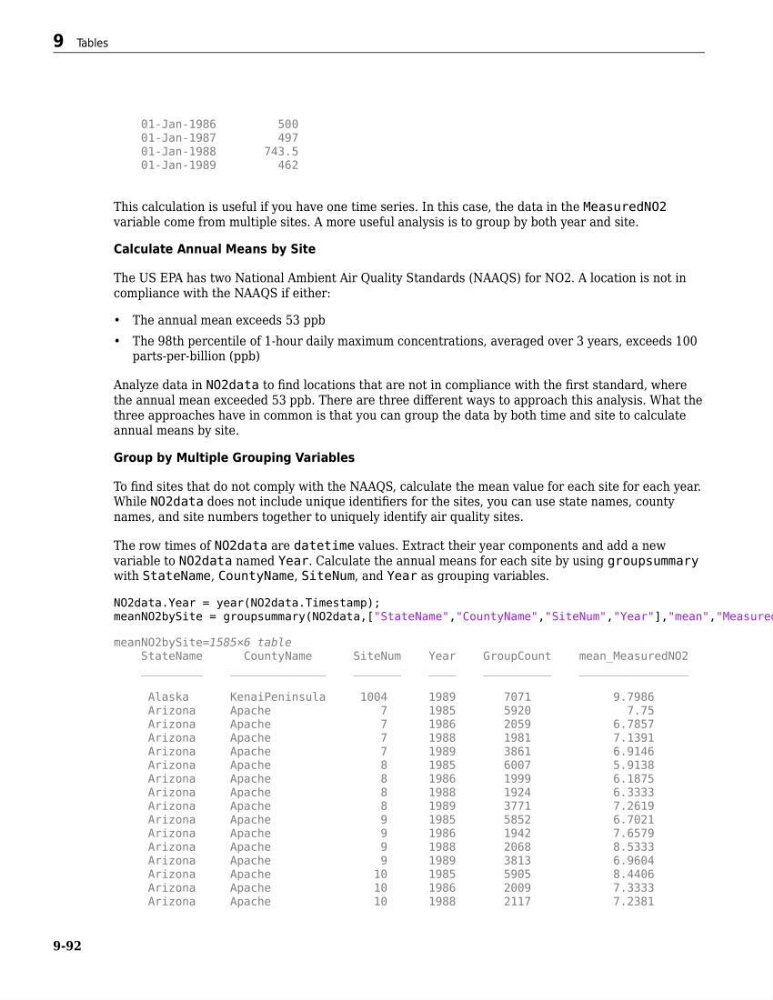
meanNO2bySite = groupsummary(NO2data,["StateName","CountyName","SiteNum","Year"],"mean","Measured
meanNO2bySite=1585×6 table
StateName
CountyName
SiteNum
Year
GroupCount
mean_MeasuredNO2
_________
______________
_______
____
__________
________________
Alaska
KenaiPeninsula
1004
1989
7071
9.7986
Arizona
Apache
7
1985
5920
7.75
Arizona
Apache
7
1986
2059
6.7857
Arizona
Apache
7
1988
1981
7.1391
Arizona
Apache
7
1989
3861
6.9146
Arizona
Apache
8
1985
6007
5.9138
Arizona
Apache
8
1986
1999
6.1875
Arizona
Apache
8
1988
1924
6.3333
Arizona
Apache
8
1989
3771
7.2619
Arizona
Apache
9
1985
5852
6.7021
Arizona
Apache
9
1986
1942
7.6579
Arizona
Apache
9
1988
2068
8.5333
Arizona
Apache
9
1989
3813
6.9604
Arizona
Apache
10
1985
5905
8.4406
Arizona
Apache
10
1986
2009
7.3333
Arizona
Apache
10
1988
2117
7.2381
9 Tables
9-92
500
01-Jan-1987
497
01-Jan-1988
743.5
01-Jan-1989
462
This calculation is useful if you have one time series. In this case, the data in the MeasuredNO2
variable come from multiple sites. A more useful analysis is to group by both year and site.
Calculate Annual Means by Site
The US EPA has two National Ambient Air Quality Standards (NAAQS) for NO2. A location is not in
compliance with the NAAQS if either:
• The annual mean exceeds 53 ppb
• The 98th percentile of 1-hour daily maximum concentrations, averaged over 3 years, exceeds 100
parts-per-billion (ppb)
Analyze data in NO2data to find locations that are not in compliance with the first standard, where
the annual mean exceeded 53 ppb. There are three different ways to approach this analysis. What the
three approaches have in common is that you can group the data by both time and site to calculate
annual means by site.
Group by Multiple Grouping Variables
To find sites that do not comply with the NAAQS, calculate the mean value for each site for each year.
While NO2data does not include unique identifiers for the sites, you can use state names, county
names, and site numbers together to uniquely identify air quality sites.
The row times of NO2data are datetime values. Extract their year components and add a new
variable to NO2data named Year. Calculate the annual means for each site by using groupsummary
with StateName, CountyName, SiteNum, and Year as grouping variables.
NO2data.Year = year(NO2data.Timestamp);
meanNO2bySite = groupsummary(NO2data,["StateName","CountyName","SiteNum","Year"],"mean","Measured
meanNO2bySite=1585×6 table
StateName
CountyName
SiteNum
Year
GroupCount
mean_MeasuredNO2
_________
______________
_______
____
__________
________________
Alaska
KenaiPeninsula
1004
1989
7071
9.7986
Arizona
Apache
7
1985
5920
7.75
Arizona
Apache
7
1986
2059
6.7857
Arizona
Apache
7
1988
1981
7.1391
Arizona
Apache
7
1989
3861
6.9146
Arizona
Apache
8
1985
6007
5.9138
Arizona
Apache
8
1986
1999
6.1875
Arizona
Apache
8
1988
1924
6.3333
Arizona
Apache
8
1989
3771
7.2619
Arizona
Apache
9
1985
5852
6.7021
Arizona
Apache
9
1986
1942
7.6579
Arizona
Apache
9
1988
2068
8.5333
Arizona
Apache
9
1989
3813
6.9604
Arizona
Apache
10
1985
5905
8.4406
Arizona
Apache
10
1986
2009
7.3333
Arizona
Apache
10
1988
2117
7.2381
9 Tables
9-92