

Data Cleaning and Calculations in Tables
This example shows how to clean data stored in a MATLAB® table. It also shows how to perform
calculations by using the numeric and categorical data that the table contains.
Because tables and timetables are containers, working with them is somewhat different than working
with ordinary numeric arrays. The example shows how to use different tabular subscripting modes,
how these modes differ, and the advantages and disadvantages of each mode for different situations.
It also shows how to access and assign data, apply transformation and summary functions, convert
table variables to different data types, and plot results.
The Ames Housing Data used in this example comes from residential real estate data for the town of
Ames, Iowa, in the United States. You can download the original data from an XLS (Excel®
Workbook) spreadsheet. The data description is available as a text file. (Used with permission of the
copyright holder. Please contact the copyright holder if you wish to publish or redistribute this data.)
Import Spreadsheet Data to Table
The best way to import a spreadsheet into MATLAB is to use the readtable function, or for data that
include timestamps, the readtimetable function. While the Ames Housing Data includes the sale
month and year for each house, the month and year are stored in separate columns. In this case, it is
simpler to use readtable.
Read the housing data. With readtable you can read data directly from a URL. Store all text data
from the spreadsheet as string arrays in the output table. Also, when readtable reads column
headers from a file, it uses them as table variable names and transforms them into valid MATLAB
identifiers. To preserve the original names, use the 'VariableNamingRule' name-value argument.
housing = readtable("http://jse.amstat.org/v19n3/decock/AmesHousing.xls","TextType","string");
Warning: Column headers from the file were modified to make them valid MATLAB identifiers before
Set 'VariableNamingRule' to 'preserve' to use the original column headers as table variable names
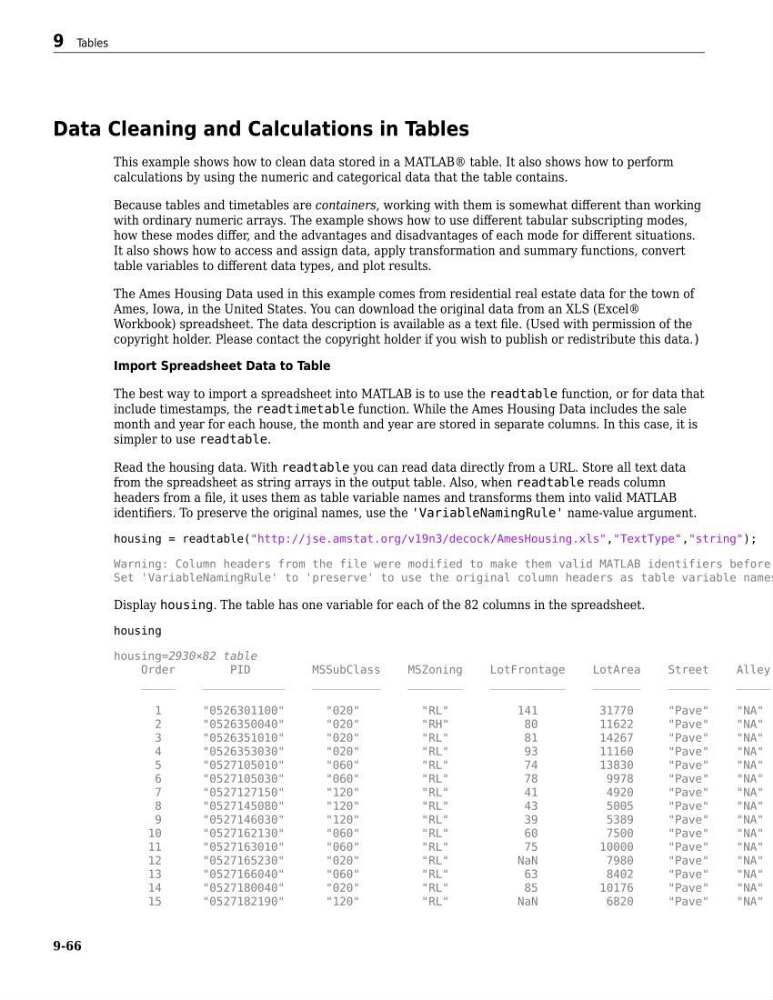
Display housing. The table has one variable for each of the 82 columns in the spreadsheet.
housing
housing=2930×82 table
Order
PID
MSSubClass
MSZoning
LotFrontage
LotArea
Street
Alley
_____
____________
__________
________
___________
_______
______
_____
1
"0526301100"
"020"
"RL"
141
31770
"Pave"
"NA"
2
"0526350040"
"020"
"RH"
80
11622
"Pave"
"NA"
3
"0526351010"
"020"
"RL"
81
14267
"Pave"
"NA"
4
"0526353030"
"020"
"RL"
93
11160
"Pave"
"NA"
5
"0527105010"
"060"
"RL"
74
13830
"Pave"
"NA"
6
"0527105030"
"060"
"RL"
78
9978
"Pave"
"NA"
7
"0527127150"
"120"
"RL"
41
4920
"Pave"
"NA"
8
"0527145080"
"120"
"RL"
43
5005
"Pave"
"NA"
9
"0527146030"
"120"
"RL"
39
5389
"Pave"
"NA"
10
"0527162130"
"060"
"RL"
60
7500
"Pave"
"NA"
11
"0527163010"
"060"
"RL"
75
10000
"Pave"
"NA"
12
"0527165230"
"020"
"RL"
NaN
7980
"Pave"
"NA"
13
"0527166040"
"060"
"RL"
63
8402
"Pave"
"NA"
14
"0527180040"
"020"
"RL"
85
10176
"Pave"
"NA"
15
"0527182190"
"120"
"RL"
NaN
6820
"Pave"
"NA"
9 Tables
9-66
This example shows how to clean data stored in a MATLAB® table. It also shows how to perform
calculations by using the numeric and categorical data that the table contains.
Because tables and timetables are containers, working with them is somewhat different than working
with ordinary numeric arrays. The example shows how to use different tabular subscripting modes,
how these modes differ, and the advantages and disadvantages of each mode for different situations.
It also shows how to access and assign data, apply transformation and summary functions, convert
table variables to different data types, and plot results.
The Ames Housing Data used in this example comes from residential real estate data for the town of
Ames, Iowa, in the United States. You can download the original data from an XLS (Excel®
Workbook) spreadsheet. The data description is available as a text file. (Used with permission of the
copyright holder. Please contact the copyright holder if you wish to publish or redistribute this data.)
Import Spreadsheet Data to Table
The best way to import a spreadsheet into MATLAB is to use the readtable function, or for data that
include timestamps, the readtimetable function. While the Ames Housing Data includes the sale
month and year for each house, the month and year are stored in separate columns. In this case, it is
simpler to use readtable.
Read the housing data. With readtable you can read data directly from a URL. Store all text data
from the spreadsheet as string arrays in the output table. Also, when readtable reads column
headers from a file, it uses them as table variable names and transforms them into valid MATLAB
identifiers. To preserve the original names, use the 'VariableNamingRule' name-value argument.
housing = readtable("http://jse.amstat.org/v19n3/decock/AmesHousing.xls","TextType","string");
Warning: Column headers from the file were modified to make them valid MATLAB identifiers before
Set 'VariableNamingRule' to 'preserve' to use the original column headers as table variable names
Display housing. The table has one variable for each of the 82 columns in the spreadsheet.
housing
housing=2930×82 table
Order
PID
MSSubClass
MSZoning
LotFrontage
LotArea
Street
Alley
_____
____________
__________
________
___________
_______
______
_____
1
"0526301100"
"020"
"RL"
141
31770
"Pave"
"NA"
2
"0526350040"
"020"
"RH"
80
11622
"Pave"
"NA"
3
"0526351010"
"020"
"RL"
81
14267
"Pave"
"NA"
4
"0526353030"
"020"
"RL"
93
11160
"Pave"
"NA"
5
"0527105010"
"060"
"RL"
74
13830
"Pave"
"NA"
6
"0527105030"
"060"
"RL"
78
9978
"Pave"
"NA"
7
"0527127150"
"120"
"RL"
41
4920
"Pave"
"NA"
8
"0527145080"
"120"
"RL"
43
5005
"Pave"
"NA"
9
"0527146030"
"120"
"RL"
39
5389
"Pave"
"NA"
10
"0527162130"
"060"
"RL"
60
7500
"Pave"
"NA"
11
"0527163010"
"060"
"RL"
75
10000
"Pave"
"NA"
12
"0527165230"
"020"
"RL"
NaN
7980
"Pave"
"NA"
13
"0527166040"
"060"
"RL"
63
8402
"Pave"
"NA"
14
"0527180040"
"020"
"RL"
85
10176
"Pave"
"NA"
15
"0527182190"
"120"
"RL"
NaN
6820
"Pave"
"NA"
9 Tables
9-66