

Values:
Min
75
Median
85
Max
94
Test3: 10x1 double
Values:
Min
72
Median
86
Max
98
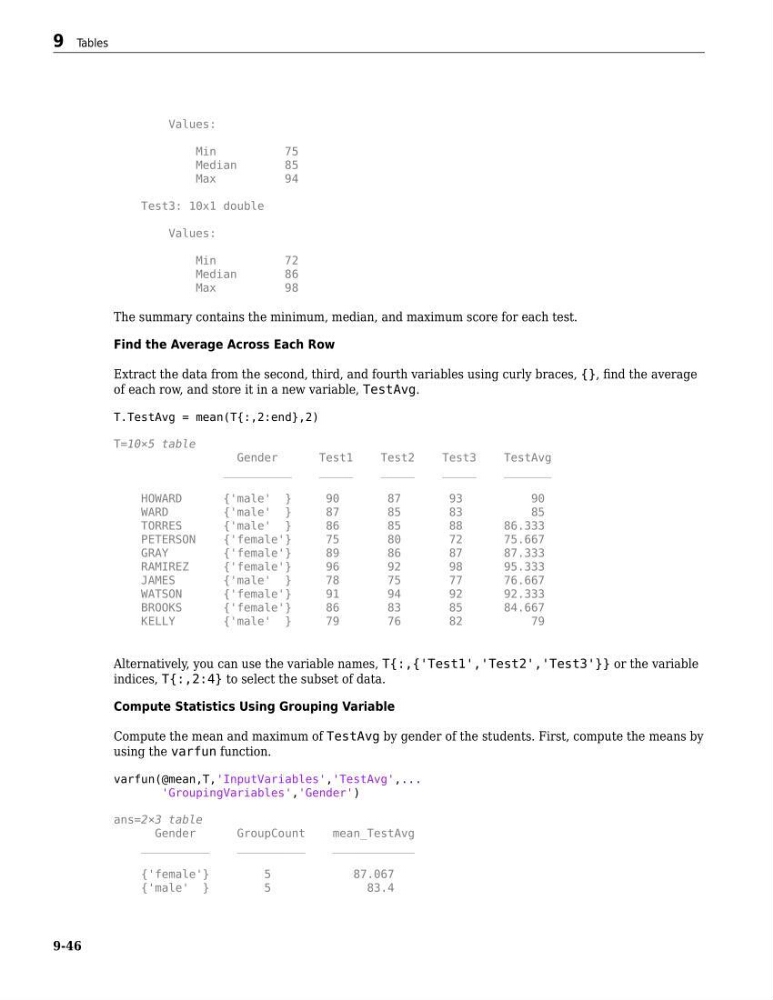
The summary contains the minimum, median, and maximum score for each test.
Find the Average Across Each Row
Extract the data from the second, third, and fourth variables using curly braces, {}, find the average
of each row, and store it in a new variable, TestAvg.
T.TestAvg = mean(T{:,2:end},2)
T=10×5 table
Gender
Test1
Test2
Test3
TestAvg
__________
_____
_____
_____
_______
HOWARD
{'male' }
90
87
93
90
WARD
{'male' }
87
85
83
85
TORRES
{'male' }
86
85
88
86.333
PETERSON
{'female'}
75
80
72
75.667
GRAY
{'female'}
89
86
87
87.333
RAMIREZ
{'female'}
96
92
98
95.333
JAMES
{'male' }
78
75
77
76.667
WATSON
{'female'}
91
94
92
92.333
BROOKS
{'female'}
86
83
85
84.667
KELLY
{'male' }
79
76
82
79
Alternatively, you can use the variable names, T{:,{'Test1','Test2','Test3'}} or the variable
indices, T{:,2:4} to select the subset of data.
Compute Statistics Using Grouping Variable
Compute the mean and maximum of TestAvg by gender of the students. First, compute the means by
using the varfun function.
varfun(@mean,T,'InputVariables','TestAvg',...
'GroupingVariables','Gender')
ans=2×3 table
Gender
GroupCount
mean_TestAvg
__________
__________
____________
{'female'}
5
87.067
{'male' }
5
83.4
9 Tables
9-46
Min
75
Median
85
Max
94
Test3: 10x1 double
Values:
Min
72
Median
86
Max
98
The summary contains the minimum, median, and maximum score for each test.
Find the Average Across Each Row
Extract the data from the second, third, and fourth variables using curly braces, {}, find the average
of each row, and store it in a new variable, TestAvg.
T.TestAvg = mean(T{:,2:end},2)
T=10×5 table
Gender
Test1
Test2
Test3
TestAvg
__________
_____
_____
_____
_______
HOWARD
{'male' }
90
87
93
90
WARD
{'male' }
87
85
83
85
TORRES
{'male' }
86
85
88
86.333
PETERSON
{'female'}
75
80
72
75.667
GRAY
{'female'}
89
86
87
87.333
RAMIREZ
{'female'}
96
92
98
95.333
JAMES
{'male' }
78
75
77
76.667
WATSON
{'female'}
91
94
92
92.333
BROOKS
{'female'}
86
83
85
84.667
KELLY
{'male' }
79
76
82
79
Alternatively, you can use the variable names, T{:,{'Test1','Test2','Test3'}} or the variable
indices, T{:,2:4} to select the subset of data.
Compute Statistics Using Grouping Variable
Compute the mean and maximum of TestAvg by gender of the students. First, compute the means by
using the varfun function.
varfun(@mean,T,'InputVariables','TestAvg',...
'GroupingVariables','Gender')
ans=2×3 table
Gender
GroupCount
mean_TestAvg
__________
__________
____________
{'female'}
5
87.067
{'male' }
5
83.4
9 Tables
9-46