

Calculations on Tables
This example shows how to perform calculations on tables.
The functions rowfun and varfun each apply a specified function to a table, yet many other
functions require numeric or homogeneous arrays as input arguments. You can extract data from
individual variables using dot indexing or from one or more variables using curly braces. The
extracted data is then an array that you can use as input to other functions. Starting in R2018a, you
also can use the groupsummary function for calculations on groups of data in a table.
Read Sample Data into Table
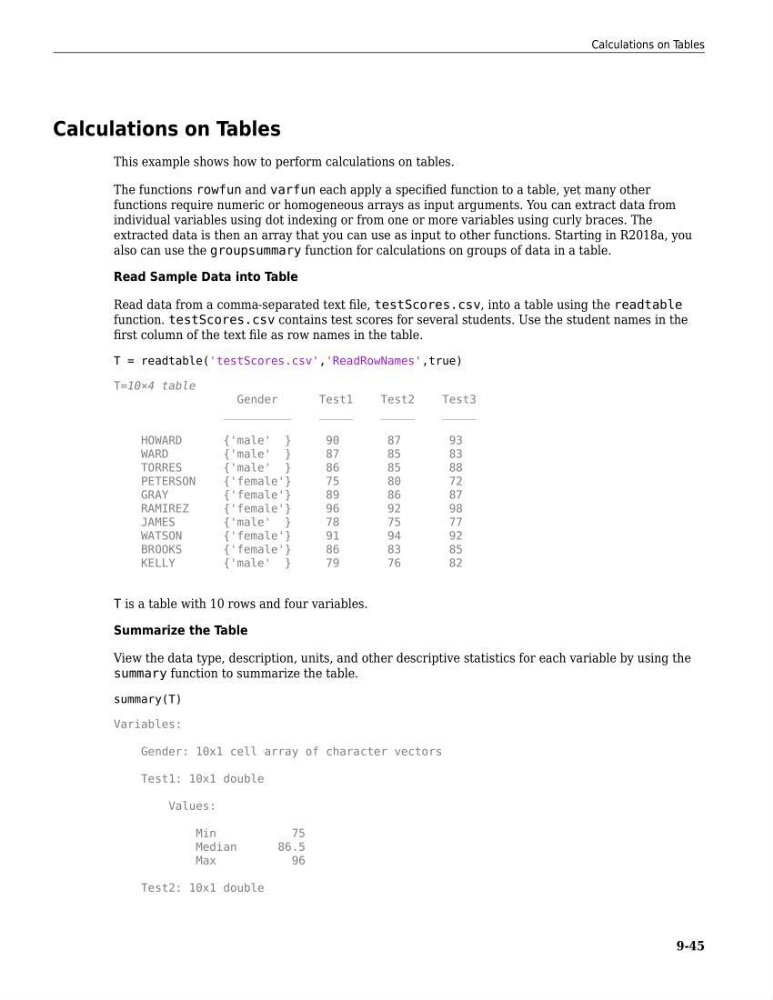
Read data from a comma-separated text file, testScores.csv, into a table using the readtable
function. testScores.csv contains test scores for several students. Use the student names in the
first column of the text file as row names in the table.
T = readtable('testScores.csv','ReadRowNames',true)
T=10×4 table
Gender
Test1
Test2
Test3
__________
_____
_____
_____
HOWARD
{'male' }
90
87
93
WARD
{'male' }
87
85
83
TORRES
{'male' }
86
85
88
PETERSON
{'female'}
75
80
72
GRAY
{'female'}
89
86
87
RAMIREZ
{'female'}
96
92
98
JAMES
{'male' }
78
75
77
WATSON
{'female'}
91
94
92
BROOKS
{'female'}
86
83
85
KELLY
{'male' }
79
76
82
T is a table with 10 rows and four variables.
Summarize the Table
View the data type, description, units, and other descriptive statistics for each variable by using the
summary function to summarize the table.
summary(T)
Variables:
Gender: 10x1 cell array of character vectors
Test1: 10x1 double
Values:
Min
75
Median
86.5
Max
96
Test2: 10x1 double
Calculations on Tables
9-45
This example shows how to perform calculations on tables.
The functions rowfun and varfun each apply a specified function to a table, yet many other
functions require numeric or homogeneous arrays as input arguments. You can extract data from
individual variables using dot indexing or from one or more variables using curly braces. The
extracted data is then an array that you can use as input to other functions. Starting in R2018a, you
also can use the groupsummary function for calculations on groups of data in a table.
Read Sample Data into Table
Read data from a comma-separated text file, testScores.csv, into a table using the readtable
function. testScores.csv contains test scores for several students. Use the student names in the
first column of the text file as row names in the table.
T = readtable('testScores.csv','ReadRowNames',true)
T=10×4 table
Gender
Test1
Test2
Test3
__________
_____
_____
_____
HOWARD
{'male' }
90
87
93
WARD
{'male' }
87
85
83
TORRES
{'male' }
86
85
88
PETERSON
{'female'}
75
80
72
GRAY
{'female'}
89
86
87
RAMIREZ
{'female'}
96
92
98
JAMES
{'male' }
78
75
77
WATSON
{'female'}
91
94
92
BROOKS
{'female'}
86
83
85
KELLY
{'male' }
79
76
82
T is a table with 10 rows and four variables.
Summarize the Table
View the data type, description, units, and other descriptive statistics for each variable by using the
summary function to summarize the table.
summary(T)
Variables:
Gender: 10x1 cell array of character vectors
Test1: 10x1 double
Values:
Min
75
Median
86.5
Max
96
Test2: 10x1 double
Calculations on Tables
9-45