

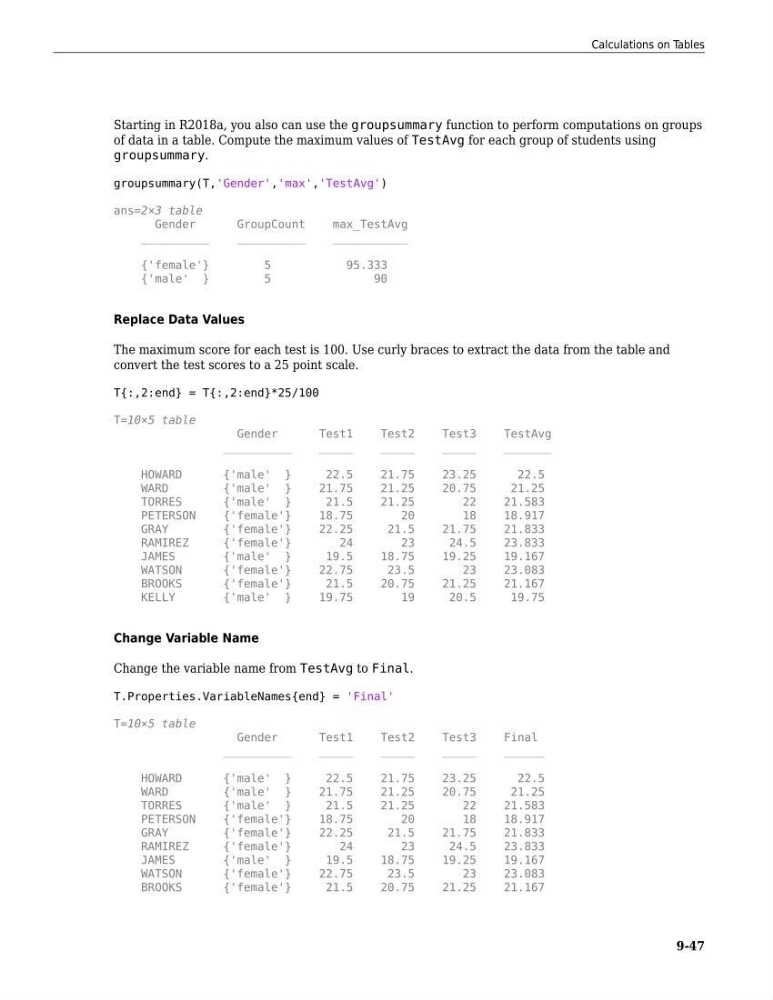
Starting in R2018a, you also can use the groupsummary function to perform computations on groups
of data in a table. Compute the maximum values of TestAvg for each group of students using
groupsummary.
groupsummary(T,'Gender','max','TestAvg')
ans=2×3 table
Gender
GroupCount
max_TestAvg
__________
__________
___________
{'female'}
5
95.333
{'male' }
5
90
Replace Data Values
The maximum score for each test is 100. Use curly braces to extract the data from the table and
convert the test scores to a 25 point scale.
T{:,2:end} = T{:,2:end}*25/100
T=10×5 table
Gender
Test1
Test2
Test3
TestAvg
__________
_____
_____
_____
_______
HOWARD
{'male' }
22.5
21.75
23.25
22.5
WARD
{'male' }
21.75
21.25
20.75
21.25
TORRES
{'male' }
21.5
21.25
22
21.583
PETERSON
{'female'}
18.75
20
18
18.917
GRAY
{'female'}
22.25
21.5
21.75
21.833
RAMIREZ
{'female'}
24
23
24.5
23.833
JAMES
{'male' }
19.5
18.75
19.25
19.167
WATSON
{'female'}
22.75
23.5
23
23.083
BROOKS
{'female'}
21.5
20.75
21.25
21.167
KELLY
{'male' }
19.75
19
20.5
19.75
Change Variable Name
Change the variable name from TestAvg to Final.
T.Properties.VariableNames{end} = 'Final'
T=10×5 table
Gender
Test1
Test2
Test3
Final
__________
_____
_____
_____
______
HOWARD
{'male' }
22.5
21.75
23.25
22.5
WARD
{'male' }
21.75
21.25
20.75
21.25
TORRES
{'male' }
21.5
21.25
22
21.583
PETERSON
{'female'}
18.75
20
18
18.917
GRAY
{'female'}
22.25
21.5
21.75
21.833
RAMIREZ
{'female'}
24
23
24.5
23.833
JAMES
{'male' }
19.5
18.75
19.25
19.167
WATSON
{'female'}
22.75
23.5
23
23.083
BROOKS
{'female'}
21.5
20.75
21.25
21.167
Calculations on Tables
9-47
of data in a table. Compute the maximum values of TestAvg for each group of students using
groupsummary.
groupsummary(T,'Gender','max','TestAvg')
ans=2×3 table
Gender
GroupCount
max_TestAvg
__________
__________
___________
{'female'}
5
95.333
{'male' }
5
90
Replace Data Values
The maximum score for each test is 100. Use curly braces to extract the data from the table and
convert the test scores to a 25 point scale.
T{:,2:end} = T{:,2:end}*25/100
T=10×5 table
Gender
Test1
Test2
Test3
TestAvg
__________
_____
_____
_____
_______
HOWARD
{'male' }
22.5
21.75
23.25
22.5
WARD
{'male' }
21.75
21.25
20.75
21.25
TORRES
{'male' }
21.5
21.25
22
21.583
PETERSON
{'female'}
18.75
20
18
18.917
GRAY
{'female'}
22.25
21.5
21.75
21.833
RAMIREZ
{'female'}
24
23
24.5
23.833
JAMES
{'male' }
19.5
18.75
19.25
19.167
WATSON
{'female'}
22.75
23.5
23
23.083
BROOKS
{'female'}
21.5
20.75
21.25
21.167
KELLY
{'male' }
19.75
19
20.5
19.75
Change Variable Name
Change the variable name from TestAvg to Final.
T.Properties.VariableNames{end} = 'Final'
T=10×5 table
Gender
Test1
Test2
Test3
Final
__________
_____
_____
_____
______
HOWARD
{'male' }
22.5
21.75
23.25
22.5
WARD
{'male' }
21.75
21.25
20.75
21.25
TORRES
{'male' }
21.5
21.25
22
21.583
PETERSON
{'female'}
18.75
20
18
18.917
GRAY
{'female'}
22.25
21.5
21.75
21.833
RAMIREZ
{'female'}
24
23
24.5
23.833
JAMES
{'male' }
19.5
18.75
19.25
19.167
WATSON
{'female'}
22.75
23.5
23
23.083
BROOKS
{'female'}
21.5
20.75
21.25
21.167
Calculations on Tables
9-47