

The normal distribution 569
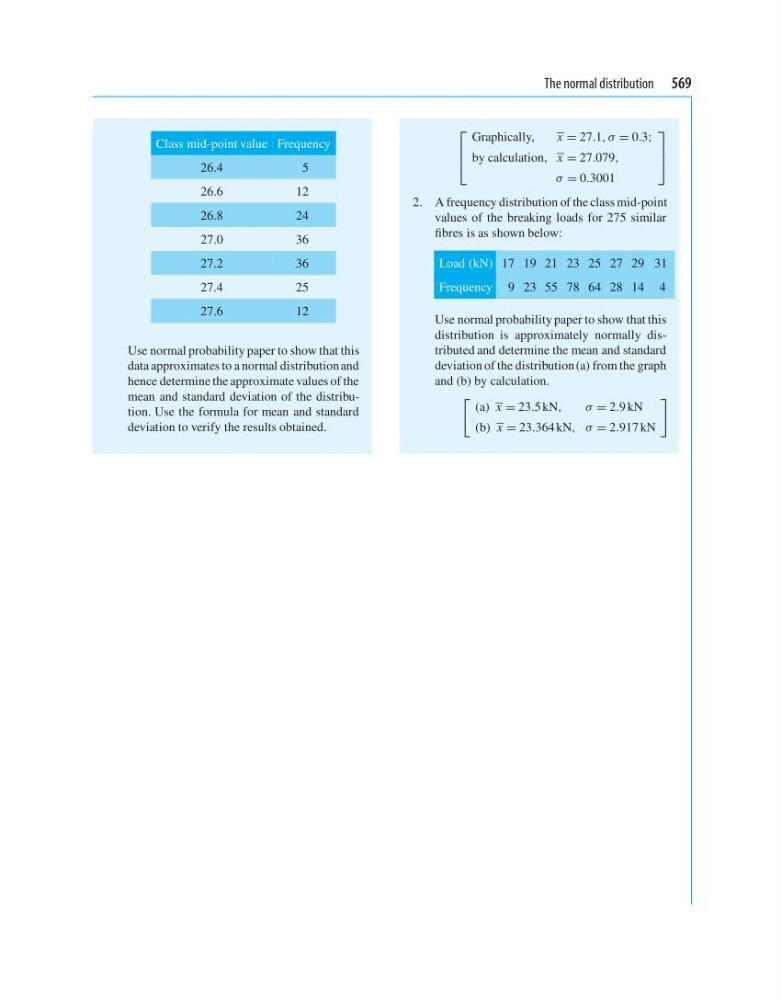
Class mid-point value Frequency
26.4
5
26.6
12
26.8
24
27.0
36
27.2
36
27.4
25
27.6
12
Use normal probability paper to show that this
data approximates to a normal distribution and
hence determine the approximate values of the
mean and standard deviation of the distribution. Use the formula for mean and standard
deviation to verify the results obtained.
⎡
⎢
⎣
Graphically,
x = 27.1, σ = 0.3;
by calculation, x = 27.079,
σ = 0.3001
⎤
⎥
⎦
2. A frequency distribution of the class mid-point
values of the breaking loads for 275 similar
fibres is as shown below:
Load (kN) 17 19 21 23 25 27 29 31
Frequency 9 23 55 78 64 28 14 4
Use normal probability paper to show that this
distribution is approximately normally distributed and determine the mean and standard
deviation of the distribution (a) from the graph
and (b) by calculation.
(a) x = 23.5 kN,
σ = 2.9 kN
(b) x = 23.364 kN, σ = 2.917 kN
Class mid-point value Frequency
26.4
5
26.6
12
26.8
24
27.0
36
27.2
36
27.4
25
27.6
12
Use normal probability paper to show that this
data approximates to a normal distribution and
hence determine the approximate values of the
mean and standard deviation of the distribution. Use the formula for mean and standard
deviation to verify the results obtained.
⎡
⎢
⎣
Graphically,
x = 27.1, σ = 0.3;
by calculation, x = 27.079,
σ = 0.3001
⎤
⎥
⎦
2. A frequency distribution of the class mid-point
values of the breaking loads for 275 similar
fibres is as shown below:
Load (kN) 17 19 21 23 25 27 29 31
Frequency 9 23 55 78 64 28 14 4
Use normal probability paper to show that this
distribution is approximately normally distributed and determine the mean and standard
deviation of the distribution (a) from the graph
and (b) by calculation.
(a) x = 23.5 kN,
σ = 2.9 kN
(b) x = 23.364 kN, σ = 2.917 kN