

Chapter 59
Linear correlation
59.1 Introduction to linear correlation
Correlation is a measure of the amount of association
existing between two variables. For linear correlation,
if points are plotted on a graph and all the points lie on
a straight line, then perfect linear correlation is said
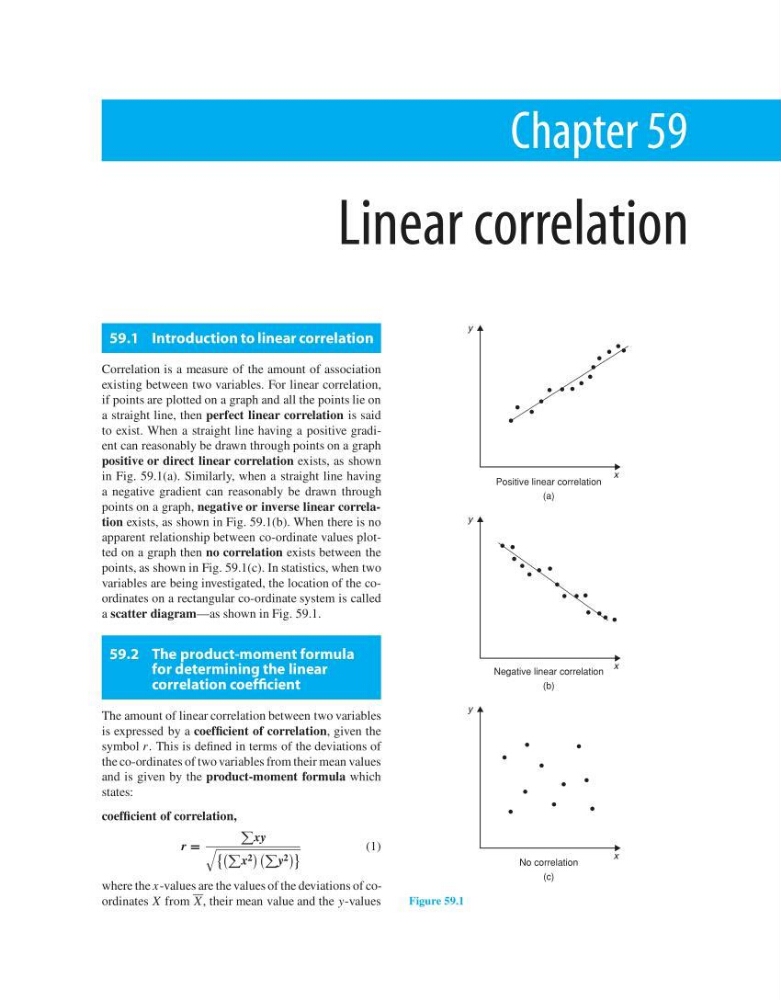
to exist. When a straight line having a positive gradient can reasonably be drawn through points on a graph
positive or direct linear correlation exists, as shown
in Fig. 59.1(a). Similarly, when a straight line having
a negative gradient can reasonably be drawn through
points on a graph, negative or inverse linear correlation exists, as shown in Fig. 59.1(b). When there is no
apparent relationship between co-ordinate values plotted on a graph then no correlation exists between the
points, as shown in Fig. 59.1(c). In statistics, when two
variables are being investigated, the location of the coordinates on a rectangular co-ordinate system is called
a scatter diagram—as shown in Fig. 59.1.
59.2 The product-moment formula
for determining the linear
correlation coefficient
The amount of linear correlation between two variables
is expressed by a coefficient of correlation, given the
symbol r. This is defined in terms of the deviations of
the co-ordinates of two variables from their mean values
and is given by the product-moment formula which
states:
coefficient of correlation,
r =
xy
x 2
y 2
(1)
where the x-values are the values of the deviations of coordinates X from X, their mean value and the y-values
y
x
Positive linear correlation
(a)
Negative linear correlation
(b)
No correlation
(c)
y
x
y
x
Figure 59.1
Linear correlation
59.1 Introduction to linear correlation
Correlation is a measure of the amount of association
existing between two variables. For linear correlation,
if points are plotted on a graph and all the points lie on
a straight line, then perfect linear correlation is said
to exist. When a straight line having a positive gradient can reasonably be drawn through points on a graph
positive or direct linear correlation exists, as shown
in Fig. 59.1(a). Similarly, when a straight line having
a negative gradient can reasonably be drawn through
points on a graph, negative or inverse linear correlation exists, as shown in Fig. 59.1(b). When there is no
apparent relationship between co-ordinate values plotted on a graph then no correlation exists between the
points, as shown in Fig. 59.1(c). In statistics, when two
variables are being investigated, the location of the coordinates on a rectangular co-ordinate system is called
a scatter diagram—as shown in Fig. 59.1.
59.2 The product-moment formula
for determining the linear
correlation coefficient
The amount of linear correlation between two variables
is expressed by a coefficient of correlation, given the
symbol r. This is defined in terms of the deviations of
the co-ordinates of two variables from their mean values
and is given by the product-moment formula which
states:
coefficient of correlation,
r =
xy
x 2
y 2
(1)
where the x-values are the values of the deviations of coordinates X from X, their mean value and the y-values
y
x
Positive linear correlation
(a)
Negative linear correlation
(b)
No correlation
(c)
y
x
y
x
Figure 59.1