

Functions and their curves 197
18.9 Worked problems on curve
sketching
Problem 13. Sketch the graphs of
(a) y = 2x 2 + 12x + 20
(b) y =−3x 2 + 12x − 15
(a) y = 2x 2 + 12x + 20 is a parabola since the equation is a quadratic. To determine the turning
point:
Gradient =
d y
dx
= 4x + 12 = 0 for a turning point.
Hence 4x =−12 and x =−3.
When x =−3, y = 2(−3) 2 + 12(−3) + 20 =2.
Hence (−3, 2) are the co-ordinates of the turning
point
d 2 y
dx 2 = 4, which is positive, hence (−3, 2) is a
minimum point.
When x = 0, y = 20, hence the curve cuts the
y-axis at y = 20.
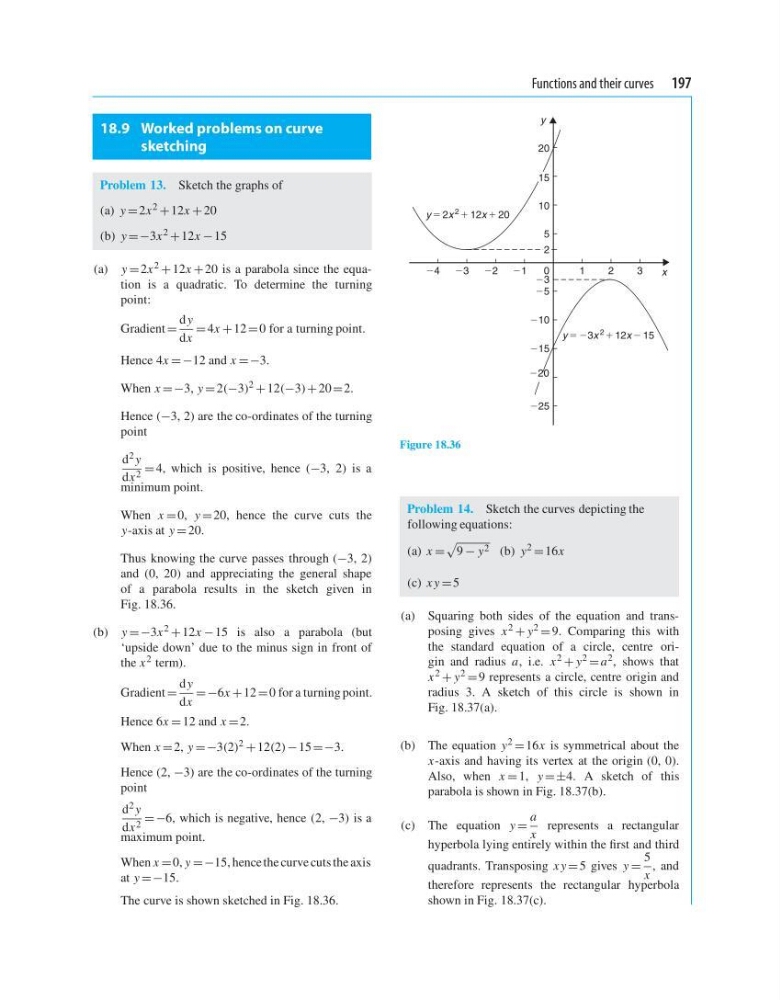
Thus knowing the curve passes through (−3, 2)
and (0, 20) and appreciating the general shape
of a parabola results in the sketch given in
Fig. 18.36.
(b) y =−3x 2 + 12x − 15 is also a parabola (but
‘upside down’ due to the minus sign in front of
the x 2 term).
Gradient =
d y
dx
=−6x + 12 = 0 for a turning point.
Hence 6x = 12 and x = 2.
When x = 2, y =−3(2) 2 + 12(2) − 15 =−3.
Hence (2, −3) are the co-ordinates of the turning
point
d 2 y
dx 2 =−6, which is negative, hence (2, −3) is a
maximum point.
When x = 0, y =−15, hence the curve cuts the axis
at y =−15.
The curve is shown sketched in Fig. 18.36.
y 5 2x 2 1 12x 1 20
y 5 23x
2 1 12x 2 15
25
23
21
1
0
2
3
22
23
24
5
210
10
20
215
225
x
y
2
220
15
Figure 18.36
Problem 14. Sketch the curves depicting the
following equations:
(a) x =
9 − y 2 (b) y 2 = 16x
(c) x y = 5
(a) Squaring both sides of the equation and transposing gives x 2 + y 2 = 9. Comparing this with
the standard equation of a circle, centre origin and radius a, i.e. x 2 + y 2 = a 2 , shows that
x 2 + y 2 = 9 represents a circle, centre origin and
radius 3. A sketch of this circle is shown in
Fig. 18.37(a).
(b) The equation y 2 = 16x is symmetrical about the
x-axis and having its vertex at the origin (0, 0).
Also, when x = 1, y =±4. A sketch of this
parabola is shown in Fig. 18.37(b).
(c) The equation y =
a
x
represents a rectangular
hyperbola lying entirely within the first and third
quadrants. Transposing x y = 5 gives y =
5
x
, and
therefore represents the rectangular hyperbola
shown in Fig. 18.37(c).
18.9 Worked problems on curve
sketching
Problem 13. Sketch the graphs of
(a) y = 2x 2 + 12x + 20
(b) y =−3x 2 + 12x − 15
(a) y = 2x 2 + 12x + 20 is a parabola since the equation is a quadratic. To determine the turning
point:
Gradient =
d y
dx
= 4x + 12 = 0 for a turning point.
Hence 4x =−12 and x =−3.
When x =−3, y = 2(−3) 2 + 12(−3) + 20 =2.
Hence (−3, 2) are the co-ordinates of the turning
point
d 2 y
dx 2 = 4, which is positive, hence (−3, 2) is a
minimum point.
When x = 0, y = 20, hence the curve cuts the
y-axis at y = 20.
Thus knowing the curve passes through (−3, 2)
and (0, 20) and appreciating the general shape
of a parabola results in the sketch given in
Fig. 18.36.
(b) y =−3x 2 + 12x − 15 is also a parabola (but
‘upside down’ due to the minus sign in front of
the x 2 term).
Gradient =
d y
dx
=−6x + 12 = 0 for a turning point.
Hence 6x = 12 and x = 2.
When x = 2, y =−3(2) 2 + 12(2) − 15 =−3.
Hence (2, −3) are the co-ordinates of the turning
point
d 2 y
dx 2 =−6, which is negative, hence (2, −3) is a
maximum point.
When x = 0, y =−15, hence the curve cuts the axis
at y =−15.
The curve is shown sketched in Fig. 18.36.
y 5 2x 2 1 12x 1 20
y 5 23x
2 1 12x 2 15
25
23
21
1
0
2
3
22
23
24
5
210
10
20
215
225
x
y
2
220
15
Figure 18.36
Problem 14. Sketch the curves depicting the
following equations:
(a) x =
9 − y 2 (b) y 2 = 16x
(c) x y = 5
(a) Squaring both sides of the equation and transposing gives x 2 + y 2 = 9. Comparing this with
the standard equation of a circle, centre origin and radius a, i.e. x 2 + y 2 = a 2 , shows that
x 2 + y 2 = 9 represents a circle, centre origin and
radius 3. A sketch of this circle is shown in
Fig. 18.37(a).
(b) The equation y 2 = 16x is symmetrical about the
x-axis and having its vertex at the origin (0, 0).
Also, when x = 1, y =±4. A sketch of this
parabola is shown in Fig. 18.37(b).
(c) The equation y =
a
x
represents a rectangular
hyperbola lying entirely within the first and third
quadrants. Transposing x y = 5 gives y =
5
x
, and
therefore represents the rectangular hyperbola
shown in Fig. 18.37(c).