

Functions and their curves 185
Ϫ4
10
20
y ϭ Ϫ(x ϩ 2)
3
(c)
–10
–20
0
2
Ϫ2
x
y
Ϫ4
10
20
y ϭ 5 Ϫ (x ϩ 2)
3
(d)
–10
–20
0
2
Ϫ2
x
y
Figure 18.22 (Continued)
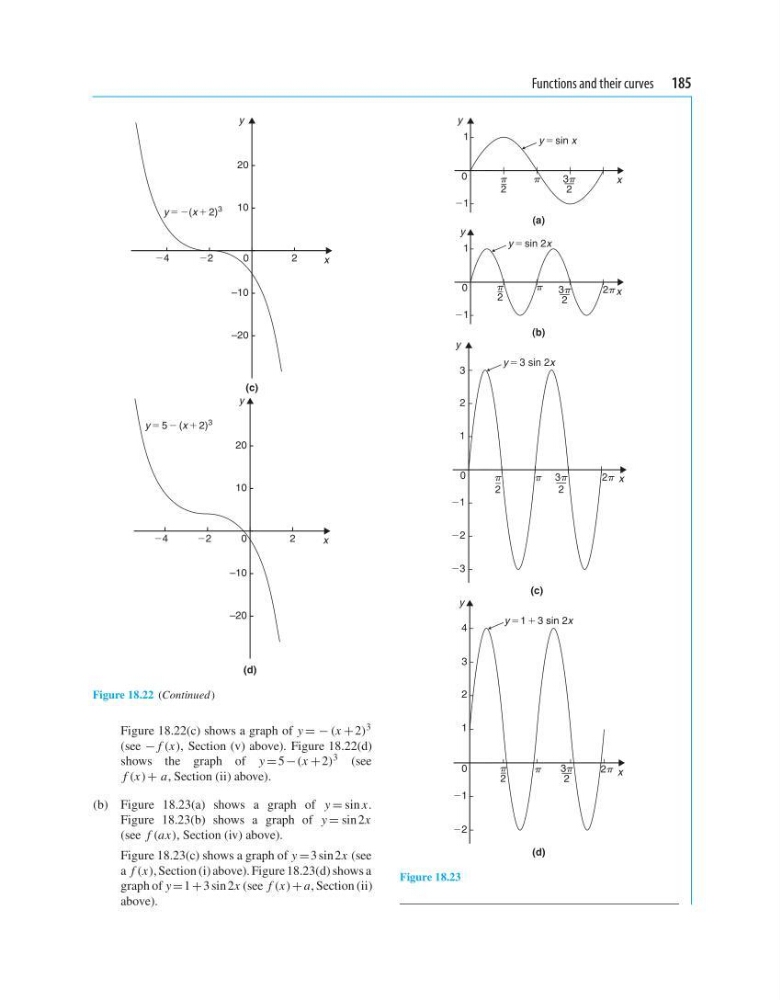
Figure 18.22(c) shows a graph of y = − (x + 2) 3
(see − f (x), Section (v) above). Figure 18.22(d)
shows the graph of y = 5 −(x + 2) 3 (see
f (x) + a, Section (ii) above).
(b) Figure 18.23(a) shows a graph of y = sin x.
Figure 18.23(b) shows a graph of y = sin 2x
(see f (ax), Section (iv) above).
Figure 18.23(c) shows a graph of y = 3 sin2x (see
a f (x), Section (i) above). Figure 18.23(d) shows a
graph of y = 1 + 3 sin2x (see f (x) + a, Section (ii)
above).
y 5 sin x
y
x
1
21
2
3
2
(a)
0
y 5 sin 2x
y
x
1
21
2
3
2
2
(b)
0
y 5 3 sin 2x
y
x
1
2
3
21
22
23
2
3
2
2
(c)
0
y ϭ1 ϩ 3 sin 2x
y
x
1
2
3
4
Ϫ1
Ϫ2
2
3
2
2
(d)
0
Figure 18.23
Ϫ4
10
20
y ϭ Ϫ(x ϩ 2)
3
(c)
–10
–20
0
2
Ϫ2
x
y
Ϫ4
10
20
y ϭ 5 Ϫ (x ϩ 2)
3
(d)
–10
–20
0
2
Ϫ2
x
y
Figure 18.22 (Continued)
Figure 18.22(c) shows a graph of y = − (x + 2) 3
(see − f (x), Section (v) above). Figure 18.22(d)
shows the graph of y = 5 −(x + 2) 3 (see
f (x) + a, Section (ii) above).
(b) Figure 18.23(a) shows a graph of y = sin x.
Figure 18.23(b) shows a graph of y = sin 2x
(see f (ax), Section (iv) above).
Figure 18.23(c) shows a graph of y = 3 sin2x (see
a f (x), Section (i) above). Figure 18.23(d) shows a
graph of y = 1 + 3 sin2x (see f (x) + a, Section (ii)
above).
y 5 sin x
y
x
1
21
2
3
2
(a)
0
y 5 sin 2x
y
x
1
21
2
3
2
2
(b)
0
y 5 3 sin 2x
y
x
1
2
3
21
22
23
2
3
2
2
(c)
0
y ϭ1 ϩ 3 sin 2x
y
x
1
2
3
4
Ϫ1
Ϫ2
2
3
2
2
(d)
0
Figure 18.23