

Functions and their curves 183
For example, if f (x) = (x − 1) 2 , and a =
1
2
, then
f (ax) =
x
2
− 1
2
.
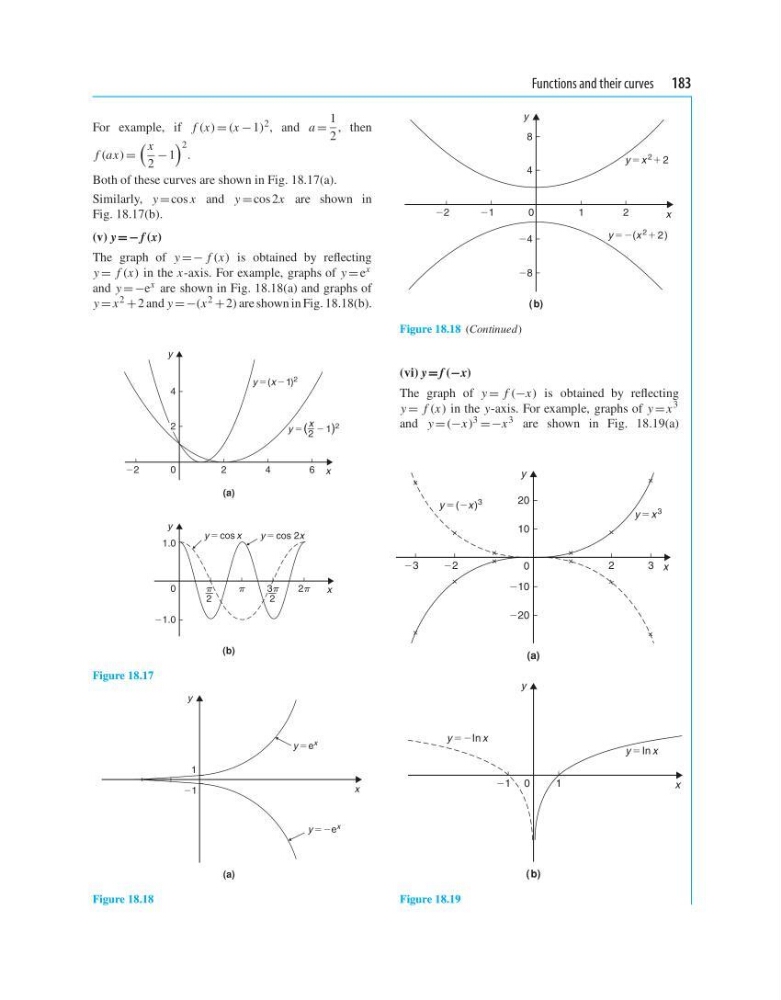
Both of these curves are shown in Fig. 18.17(a).
Similarly, y = cos x and y = cos 2x are shown in
Fig. 18.17(b).
(v) y =−f (x)
The graph of y =− f (x) is obtained by reflecting
y = f (x) in the x-axis. For example, graphs of y = e x
and y =−e x are shown in Fig. 18.18(a) and graphs of
y = x 2 + 2 and y =−(x 2 + 2) are shown in Fig. 18.18(b).
1.0
21.0
0
4
(a)
(b)
2
2
0
4
6
22
( 2 1) 2
2
x
y 5
x
y 5 cos x
y 5 cos 2x
2
2
2
3
x
y 5(x 21) 2
y
y
Figure 18.17
(a)
y
x
21
y 5e x
y 52e
x
1
Figure 18.18
(b)
y
x
22
24
28
21
1
4
8
2
0
y 52(x
2 1 2)
y 5 x
2 1 2
Figure 18.18 (Continued)
(vi) y = f (−x)
The graph of y = f (−x) is obtained by reflecting
y = f (x) in the y-axis. For example, graphs of y = x
3
and y = (−x) 3 =−x 3 are shown in Fig. 18.19(a)
(a)
10
0
20
220
210
23
22
2
3
(b)
21
1
0
y 5 (2x )
3
y 5 x
3
y 52In x
y 5 In x
y
x
y
x
Figure 18.19
For example, if f (x) = (x − 1) 2 , and a =
1
2
, then
f (ax) =
x
2
− 1
2
.
Both of these curves are shown in Fig. 18.17(a).
Similarly, y = cos x and y = cos 2x are shown in
Fig. 18.17(b).
(v) y =−f (x)
The graph of y =− f (x) is obtained by reflecting
y = f (x) in the x-axis. For example, graphs of y = e x
and y =−e x are shown in Fig. 18.18(a) and graphs of
y = x 2 + 2 and y =−(x 2 + 2) are shown in Fig. 18.18(b).
1.0
21.0
0
4
(a)
(b)
2
2
0
4
6
22
( 2 1) 2
2
x
y 5
x
y 5 cos x
y 5 cos 2x
2
2
2
3
x
y 5(x 21) 2
y
y
Figure 18.17
(a)
y
x
21
y 5e x
y 52e
x
1
Figure 18.18
(b)
y
x
22
24
28
21
1
4
8
2
0
y 52(x
2 1 2)
y 5 x
2 1 2
Figure 18.18 (Continued)
(vi) y = f (−x)
The graph of y = f (−x) is obtained by reflecting
y = f (x) in the y-axis. For example, graphs of y = x
3
and y = (−x) 3 =−x 3 are shown in Fig. 18.19(a)
(a)
10
0
20
220
210
23
22
2
3
(b)
21
1
0
y 5 (2x )
3
y 5 x
3
y 52In x
y 5 In x
y
x
y
x
Figure 18.19