

142 Higher Engineering Mathematics
0
y
t
/2
/
3/2
2/
y 5 2 cos t
y 5 2 cos(t 23/10)
22
2
3/10 rads
Figure 14.24
Graphs of sin
2 A and cos 2 A
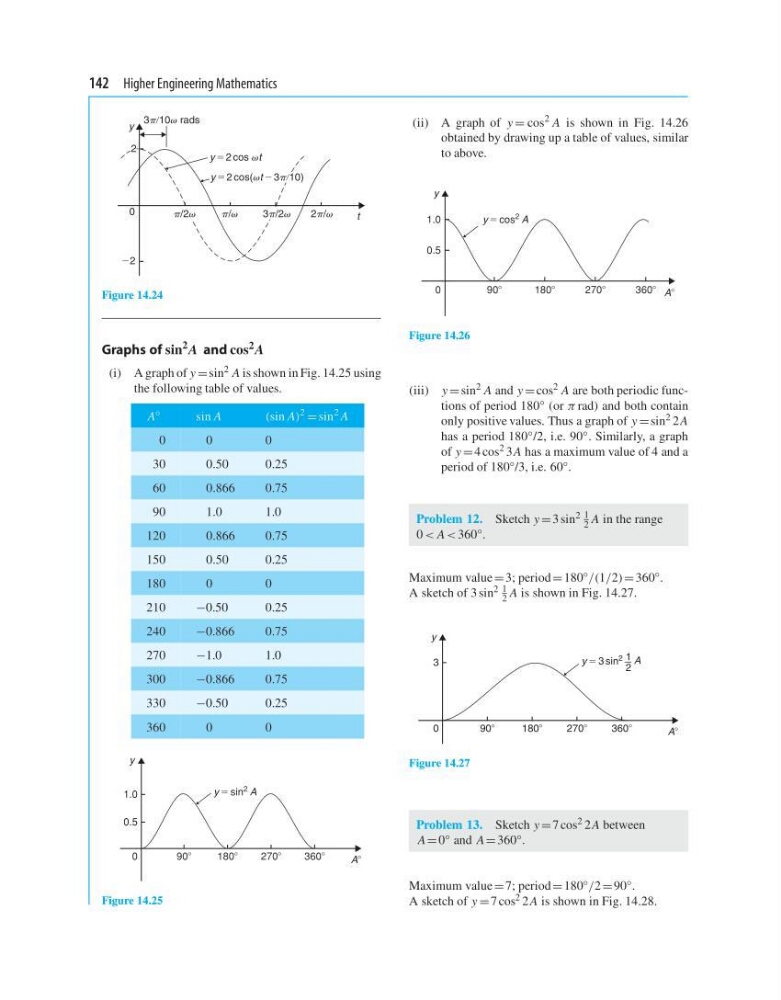
(i) A graph of y = sin 2 A is shown in Fig. 14.25 using
the following table of values.
A
◦
sin A
(sin A)
2
= sin
2 A
0
0
0
30
0.50
0.25
60
0.866
0.75
90
1.0
1.0
120
0.866
0.75
150
0.50
0.25
180
0
0
210
−0.50
0.25
240
−0.866
0.75
270
−1.0
1.0
300
−0.866
0.75
330
−0.50
0.25
360
0
0
0
0.5
1.0
y
908
1808
2708
3608
A8
y 5 sin
2 A
Figure 14.25
(ii) A graph of y = cos
2 A is shown in Fig. 14.26
obtained by drawing up a table of values, similar
to above.
0
0.5
1.0
y
908
1808
2708
3608 A8
y 5 cos 2 A
Figure 14.26
(iii) y = sin 2 A and y = cos 2 A are both periodic functions of period 180 ◦ (or π rad) and both contain
only positive values. Thus a graph of y = sin 2 2 A
has a period 180 ◦ /2, i.e. 90 ◦ . Similarly, a graph
of y = 4 cos 2 3 A has a maximum value of 4 and a
period of 180 ◦ /3, i.e. 60 ◦ .
Problem 12. Sketch y = 3 sin 2 1
2 A in the range
0 < A < 360 ◦ .
Maximum value = 3; period = 180 ◦ /(1/2) = 360 ◦ .
A sketch of 3sin 2 1
2 A is shown in Fig. 14.27.
0
3
y
908
1808
2708
3608
A8
y 5 3 sin
2 A
1
2
Figure 14.27
Problem 13. Sketch y = 7 cos 2 2 A between
A = 0 ◦ and A = 360 ◦ .
Maximum value = 7; period = 180 ◦ /2 = 90 ◦ .
A sketch of y = 7 cos 2 2 A is shown in Fig. 14.28.
0
y
t
/2
/
3/2
2/
y 5 2 cos t
y 5 2 cos(t 23/10)
22
2
3/10 rads
Figure 14.24
Graphs of sin
2 A and cos 2 A
(i) A graph of y = sin 2 A is shown in Fig. 14.25 using
the following table of values.
A
◦
sin A
(sin A)
2
= sin
2 A
0
0
0
30
0.50
0.25
60
0.866
0.75
90
1.0
1.0
120
0.866
0.75
150
0.50
0.25
180
0
0
210
−0.50
0.25
240
−0.866
0.75
270
−1.0
1.0
300
−0.866
0.75
330
−0.50
0.25
360
0
0
0
0.5
1.0
y
908
1808
2708
3608
A8
y 5 sin
2 A
Figure 14.25
(ii) A graph of y = cos
2 A is shown in Fig. 14.26
obtained by drawing up a table of values, similar
to above.
0
0.5
1.0
y
908
1808
2708
3608 A8
y 5 cos 2 A
Figure 14.26
(iii) y = sin 2 A and y = cos 2 A are both periodic functions of period 180 ◦ (or π rad) and both contain
only positive values. Thus a graph of y = sin 2 2 A
has a period 180 ◦ /2, i.e. 90 ◦ . Similarly, a graph
of y = 4 cos 2 3 A has a maximum value of 4 and a
period of 180 ◦ /3, i.e. 60 ◦ .
Problem 12. Sketch y = 3 sin 2 1
2 A in the range
0 < A < 360 ◦ .
Maximum value = 3; period = 180 ◦ /(1/2) = 360 ◦ .
A sketch of 3sin 2 1
2 A is shown in Fig. 14.27.
0
3
y
908
1808
2708
3608
A8
y 5 3 sin
2 A
1
2
Figure 14.27
Problem 13. Sketch y = 7 cos 2 2 A between
A = 0 ◦ and A = 360 ◦ .
Maximum value = 7; period = 180 ◦ /2 = 90 ◦ .
A sketch of y = 7 cos 2 2 A is shown in Fig. 14.28.