

Trigonometric waveforms 141
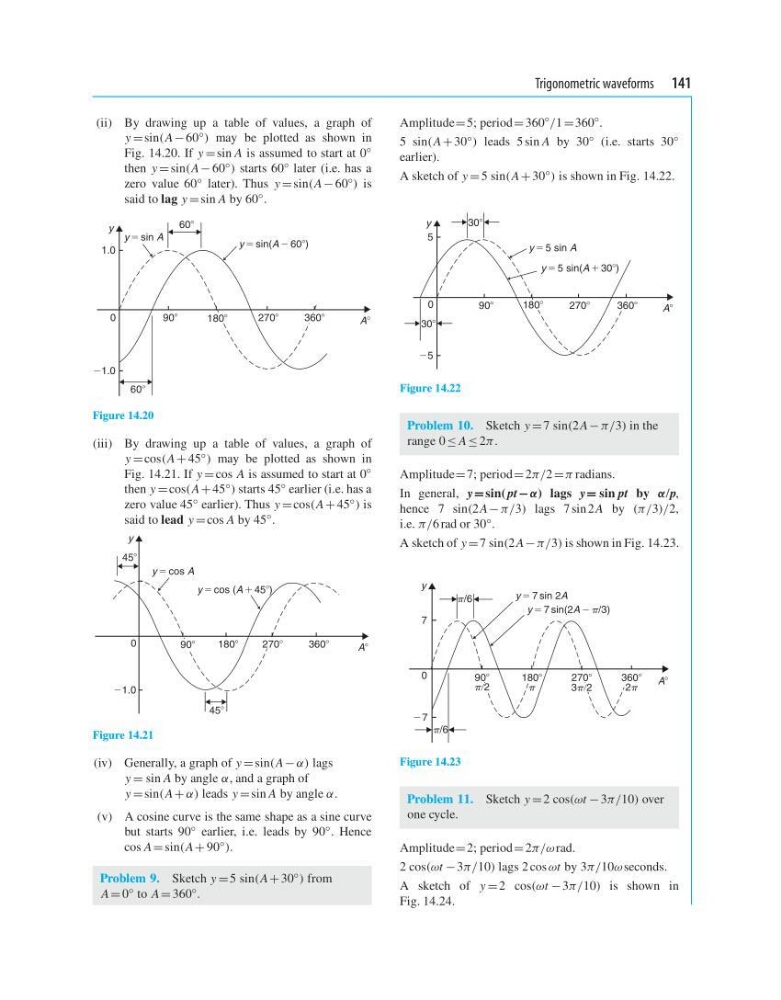
(ii) By drawing up a table of values, a graph of
y = sin(A − 60 ◦ ) may be plotted as shown in
Fig. 14.20. If y = sin A is assumed to start at 0 ◦
then y = sin(A − 60 ◦ ) starts 60 ◦ later (i.e. has a
zero value 60 ◦ later). Thus y = sin(A − 60 ◦ ) is
said to lag y = sin A by 60 ◦ .
908
2708
y
A8
0
21.0
1.0
y 5 sin(A 2 608)
y 5 sin A
608
608
1808
3608
Figure 14.20
(iii) By drawing up a table of values, a graph of
y = cos(A + 45 ◦ ) may be plotted as shown in
Fig. 14.21. If y = cos A is assumed to start at 0
◦
then y = cos(A + 45 ◦ ) starts 45 ◦ earlier (i.e. has a
zero value 45 ◦ earlier). Thus y = cos(A + 45 ◦ ) is
said to lead y = cos A by 45 ◦ .
1808
458
3608
A8
0
y
21.0
y 5 cos (A 1 458)
y 5 cos A
458
2708
908
Figure 14.21
(iv) Generally, a graph of y = sin(A − α) lags
y = sin A by angle α, and a graph of
y = sin(A + α) leads y = sin A by angle α.
(v) A cosine curve is the same shape as a sine curve
but starts 90 ◦ earlier, i.e. leads by 90 ◦ . Hence
cos A = sin(A + 90 ◦ ).
Problem 9. Sketch y = 5 sin(A + 30 ◦ ) from
A = 0 ◦ to A = 360 ◦ .
Amplitude= 5; period = 360
◦
/1 =360
◦ .
5 sin(A + 30 ◦ ) leads 5 sin A by 30 ◦ (i.e. starts 30 ◦
earlier).
A sketch of y = 5 sin(A + 30 ◦ ) is shown in Fig. 14.22.
908
2708
A8
0
5
25
y 5 5 sin(A 1 308)
y 5 5 sin A
308
308
1808
3608
y
Figure 14.22
Problem 10. Sketch y = 7 sin(2 A − π/3) in the
range 0 ≤ A ≤ 2π.
Amplitude= 7; period = 2π/2 =π radians.
In general, y = sin(pt − α) lags y = sin pt by α/p,
hence 7 sin(2 A − π/3) lags 7 sin 2 A by (π/3)/2,
i.e. π/6 rad or 30 ◦ .
A sketch of y = 7 sin(2 A − π/3) is shown in Fig. 14.23.
0
7
y
A8
3608
y 5 7 sin 2A
y 5 7 sin(2A 2 /3)
/6
/6
2
7
2708
1808
908
3/2
/2
Figure 14.23
Problem 11. Sketch y = 2 cos(ωt − 3π/10) over
one cycle.
Amplitude= 2; period = 2π/ω rad.
2 cos(ωt − 3π/10) lags 2 cos ωt by 3π/10ω seconds.
A sketch of y = 2 cos(ωt − 3π/10) is shown in
Fig. 14.24.
(ii) By drawing up a table of values, a graph of
y = sin(A − 60 ◦ ) may be plotted as shown in
Fig. 14.20. If y = sin A is assumed to start at 0 ◦
then y = sin(A − 60 ◦ ) starts 60 ◦ later (i.e. has a
zero value 60 ◦ later). Thus y = sin(A − 60 ◦ ) is
said to lag y = sin A by 60 ◦ .
908
2708
y
A8
0
21.0
1.0
y 5 sin(A 2 608)
y 5 sin A
608
608
1808
3608
Figure 14.20
(iii) By drawing up a table of values, a graph of
y = cos(A + 45 ◦ ) may be plotted as shown in
Fig. 14.21. If y = cos A is assumed to start at 0
◦
then y = cos(A + 45 ◦ ) starts 45 ◦ earlier (i.e. has a
zero value 45 ◦ earlier). Thus y = cos(A + 45 ◦ ) is
said to lead y = cos A by 45 ◦ .
1808
458
3608
A8
0
y
21.0
y 5 cos (A 1 458)
y 5 cos A
458
2708
908
Figure 14.21
(iv) Generally, a graph of y = sin(A − α) lags
y = sin A by angle α, and a graph of
y = sin(A + α) leads y = sin A by angle α.
(v) A cosine curve is the same shape as a sine curve
but starts 90 ◦ earlier, i.e. leads by 90 ◦ . Hence
cos A = sin(A + 90 ◦ ).
Problem 9. Sketch y = 5 sin(A + 30 ◦ ) from
A = 0 ◦ to A = 360 ◦ .
Amplitude= 5; period = 360
◦
/1 =360
◦ .
5 sin(A + 30 ◦ ) leads 5 sin A by 30 ◦ (i.e. starts 30 ◦
earlier).
A sketch of y = 5 sin(A + 30 ◦ ) is shown in Fig. 14.22.
908
2708
A8
0
5
25
y 5 5 sin(A 1 308)
y 5 5 sin A
308
308
1808
3608
y
Figure 14.22
Problem 10. Sketch y = 7 sin(2 A − π/3) in the
range 0 ≤ A ≤ 2π.
Amplitude= 7; period = 2π/2 =π radians.
In general, y = sin(pt − α) lags y = sin pt by α/p,
hence 7 sin(2 A − π/3) lags 7 sin 2 A by (π/3)/2,
i.e. π/6 rad or 30 ◦ .
A sketch of y = 7 sin(2 A − π/3) is shown in Fig. 14.23.
0
7
y
A8
3608
y 5 7 sin 2A
y 5 7 sin(2A 2 /3)
/6
/6
2
7
2708
1808
908
3/2
/2
Figure 14.23
Problem 11. Sketch y = 2 cos(ωt − 3π/10) over
one cycle.
Amplitude= 2; period = 2π/ω rad.
2 cos(ωt − 3π/10) lags 2 cos ωt by 3π/10ω seconds.
A sketch of y = 2 cos(ωt − 3π/10) is shown in
Fig. 14.24.