

Trigonometric waveforms 143
0
7
y
908
1808
2708
3608
A8
y 5 7cos 2 2A
Figure 14.28
Now try the following exercise
Exercise 62 Further problems on sine and
cosine curves
In Problems 1 to 9 state the amplitude and period
of the waveform and sketch the curve between
0 ◦ and 360 ◦ .
1. y = cos 3A
[1, 120 ◦ ]
2. y = 2 sin
5x
2
[2, 144 ◦ ]
3. y = 3 sin4t
[3, 90 ◦ ]
4. y = 3 cos
θ
2
[3, 720 ◦ ]
5. y =
7
2
sin
3x
8
7
2
, 960 ◦
6. y = 6 sin(t − 45 ◦ )
[6, 360 ◦ ]
7. y = 4 cos(2θ + 30 ◦ )
[4, 180 ◦ ]
8. y = 2 sin
2 2t
[2, 90 ◦ ]
9. y = 5 cos 2 3
2
θ
[5, 120 ◦ ]
14.5 Sinusoidal form A sin (ωt ± α)
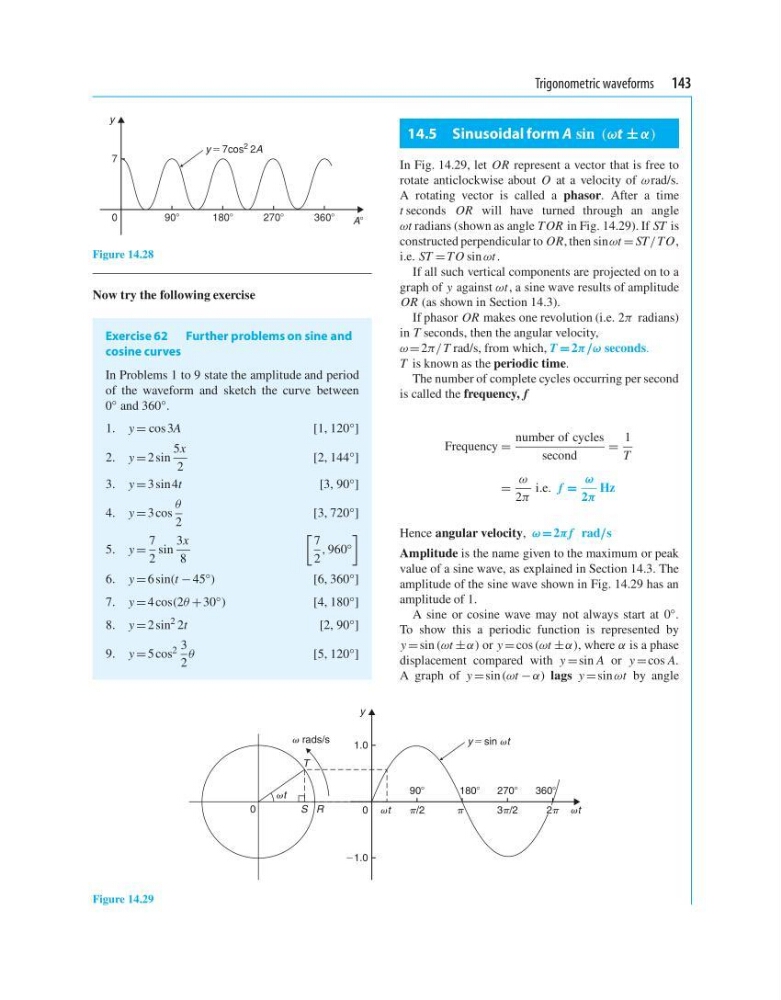
In Fig. 14.29, let OR represent a vector that is free to
rotate anticlockwise about O at a velocity of ω rad/s.
A rotating vector is called a phasor. After a time
t seconds OR will have turned through an angle
ωt radians (shown as angle TOR in Fig. 14.29). If ST is
constructed perpendicular to OR, then sinωt = ST/ TO,
i.e. ST = TO sin ωt .
If all such vertical components are projected on to a
graph of y against ωt , a sine wave results of amplitude
OR (as shown in Section 14.3).
If phasor OR makes one revolution (i.e. 2π radians)
in T seconds, then the angular velocity,
ω = 2π/ T rad/s, from which, T = 2π/ω seconds.
T is known as the periodic time.
The number of complete cycles occurring per second
is called the frequency, f
Frequency =
number of cycles
second
=
1
T
=
ω
2π
i.e. f =
ω
2π
Hz
Hence angular velocity, ω = 2πf rad/s
Amplitude is the name given to the maximum or peak
value of a sine wave, as explained in Section 14.3. The
amplitude of the sine wave shown in Fig. 14.29 has an
amplitude of 1.
A sine or cosine wave may not always start at 0 ◦ .
To show this a periodic function is represented by
y = sin (ωt ± α) or y = cos (ωt ± α), where α is a phase
displacement compared with y = sin A or y = cos A.
A graph of y = sin (ωt − α) lags y = sin ωt by angle
0
1.0
y
908
/2
3/2
1808
2708
3608
Ϫ1.0
y ϭ sin t
t
t
t
S
0
R
T
rads/s
2
Figure 14.29
0
7
y
908
1808
2708
3608
A8
y 5 7cos 2 2A
Figure 14.28
Now try the following exercise
Exercise 62 Further problems on sine and
cosine curves
In Problems 1 to 9 state the amplitude and period
of the waveform and sketch the curve between
0 ◦ and 360 ◦ .
1. y = cos 3A
[1, 120 ◦ ]
2. y = 2 sin
5x
2
[2, 144 ◦ ]
3. y = 3 sin4t
[3, 90 ◦ ]
4. y = 3 cos
θ
2
[3, 720 ◦ ]
5. y =
7
2
sin
3x
8
7
2
, 960 ◦
6. y = 6 sin(t − 45 ◦ )
[6, 360 ◦ ]
7. y = 4 cos(2θ + 30 ◦ )
[4, 180 ◦ ]
8. y = 2 sin
2 2t
[2, 90 ◦ ]
9. y = 5 cos 2 3
2
θ
[5, 120 ◦ ]
14.5 Sinusoidal form A sin (ωt ± α)
In Fig. 14.29, let OR represent a vector that is free to
rotate anticlockwise about O at a velocity of ω rad/s.
A rotating vector is called a phasor. After a time
t seconds OR will have turned through an angle
ωt radians (shown as angle TOR in Fig. 14.29). If ST is
constructed perpendicular to OR, then sinωt = ST/ TO,
i.e. ST = TO sin ωt .
If all such vertical components are projected on to a
graph of y against ωt , a sine wave results of amplitude
OR (as shown in Section 14.3).
If phasor OR makes one revolution (i.e. 2π radians)
in T seconds, then the angular velocity,
ω = 2π/ T rad/s, from which, T = 2π/ω seconds.
T is known as the periodic time.
The number of complete cycles occurring per second
is called the frequency, f
Frequency =
number of cycles
second
=
1
T
=
ω
2π
i.e. f =
ω
2π
Hz
Hence angular velocity, ω = 2πf rad/s
Amplitude is the name given to the maximum or peak
value of a sine wave, as explained in Section 14.3. The
amplitude of the sine wave shown in Fig. 14.29 has an
amplitude of 1.
A sine or cosine wave may not always start at 0 ◦ .
To show this a periodic function is represented by
y = sin (ωt ± α) or y = cos (ωt ± α), where α is a phase
displacement compared with y = sin A or y = cos A.
A graph of y = sin (ωt − α) lags y = sin ωt by angle
0
1.0
y
908
/2
3/2
1808
2708
3608
Ϫ1.0
y ϭ sin t
t
t
t
S
0
R
T
rads/s
2
Figure 14.29