

Trigonometric waveforms 139
y
1.0
21.0
0
A°
y 5 sin A
y 5 sin 2A
360°
90°
180°
270°
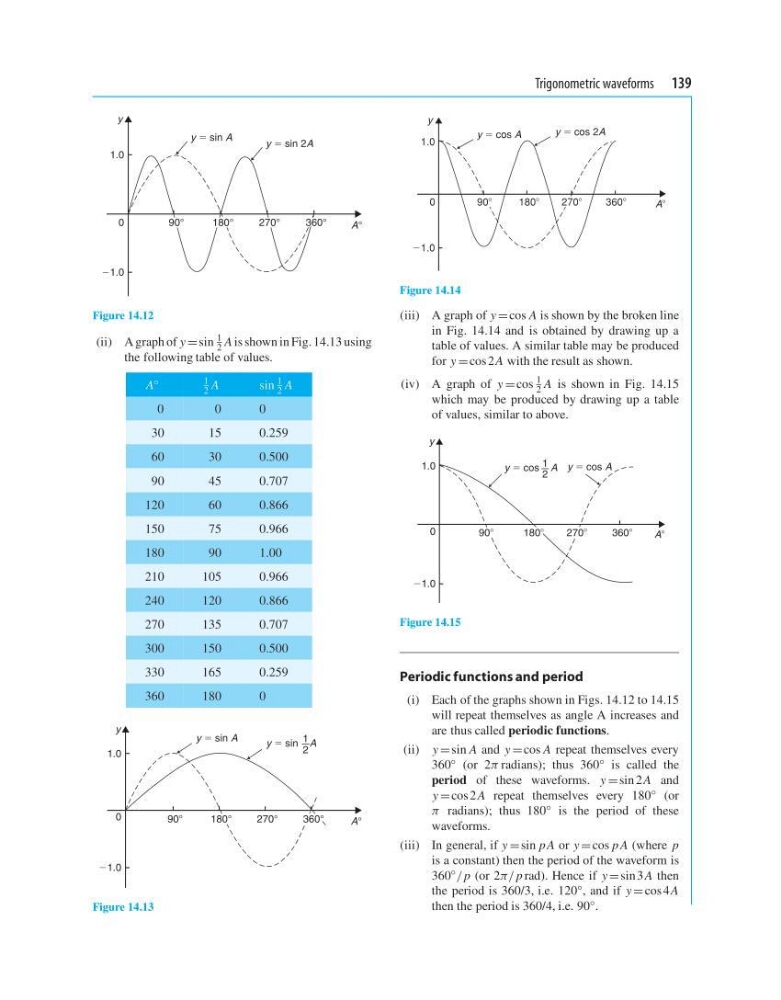
Figure 14.12
(ii) A graph of y = sin
1
2 A is shown in Fig. 14.13 using
the following table of values.
A ◦
1
2 A
sin
1
2 A
0
0
0
30
15
0.259
60
30
0.500
90
45
0.707
120
60
0.866
150
75
0.966
180
90
1.00
210
105
0.966
240
120
0.866
270
135
0.707
300
150
0.500
330
165
0.259
360
180
0
y
1.0
21.0
0
1
2
A°
y 5 sin A
y 5 sin A
360°
270°
180°
90°
Figure 14.13
y
A8
0
21.0
1.0
y 5 cos A
y 5 cos 2A
1808
3608
908
2708
Figure 14.14
(iii) A graph of y = cos A is shown by the broken line
in Fig. 14.14 and is obtained by drawing up a
table of values. A similar table may be produced
for y = cos 2 A with the result as shown.
(iv) A graph of y = cos
1
2 A is shown in Fig. 14.15
which may be produced by drawing up a table
of values, similar to above.
y
1.0
21.0
0
3608
A8
1
2
y 5 cos A
y 5 cos A
908
1808
2708
Figure 14.15
Periodic functions and period
(i) Each of the graphs shown in Figs. 14.12 to 14.15
will repeat themselves as angle A increases and
are thus called periodic functions.
(ii) y = sin A and y = cos A repeat themselves every
360 ◦ (or 2π radians); thus 360 ◦ is called the
period of these waveforms. y = sin 2 A and
y = cos 2 A repeat themselves every 180 ◦ (or
π radians); thus 180 ◦ is the period of these
waveforms.
(iii) In general, if y = sin p A or y = cos p A (where p
is a constant) then the period of the waveform is
360
◦
/ p (or 2π/ p rad). Hence if y = sin 3 A then
the period is 360/3, i.e. 120 ◦ , and if y = cos 4 A
then the period is 360/4, i.e. 90 ◦ .
y
1.0
21.0
0
A°
y 5 sin A
y 5 sin 2A
360°
90°
180°
270°
Figure 14.12
(ii) A graph of y = sin
1
2 A is shown in Fig. 14.13 using
the following table of values.
A ◦
1
2 A
sin
1
2 A
0
0
0
30
15
0.259
60
30
0.500
90
45
0.707
120
60
0.866
150
75
0.966
180
90
1.00
210
105
0.966
240
120
0.866
270
135
0.707
300
150
0.500
330
165
0.259
360
180
0
y
1.0
21.0
0
1
2
A°
y 5 sin A
y 5 sin A
360°
270°
180°
90°
Figure 14.13
y
A8
0
21.0
1.0
y 5 cos A
y 5 cos 2A
1808
3608
908
2708
Figure 14.14
(iii) A graph of y = cos A is shown by the broken line
in Fig. 14.14 and is obtained by drawing up a
table of values. A similar table may be produced
for y = cos 2 A with the result as shown.
(iv) A graph of y = cos
1
2 A is shown in Fig. 14.15
which may be produced by drawing up a table
of values, similar to above.
y
1.0
21.0
0
3608
A8
1
2
y 5 cos A
y 5 cos A
908
1808
2708
Figure 14.15
Periodic functions and period
(i) Each of the graphs shown in Figs. 14.12 to 14.15
will repeat themselves as angle A increases and
are thus called periodic functions.
(ii) y = sin A and y = cos A repeat themselves every
360 ◦ (or 2π radians); thus 360 ◦ is called the
period of these waveforms. y = sin 2 A and
y = cos 2 A repeat themselves every 180 ◦ (or
π radians); thus 180 ◦ is the period of these
waveforms.
(iii) In general, if y = sin p A or y = cos p A (where p
is a constant) then the period of the waveform is
360
◦
/ p (or 2π/ p rad). Hence if y = sin 3 A then
the period is 360/3, i.e. 120 ◦ , and if y = cos 4 A
then the period is 360/4, i.e. 90 ◦ .