

138 Higher Engineering Mathematics
1208
908
608
3608
3308 20.5
21.0
1.0
0.5
T
y
R
S
S9
T 9
y 5 sin x
Angle x 8
308 608
1208
2108
2708
3308
3008
2708
2408
2108
1808
1508
0
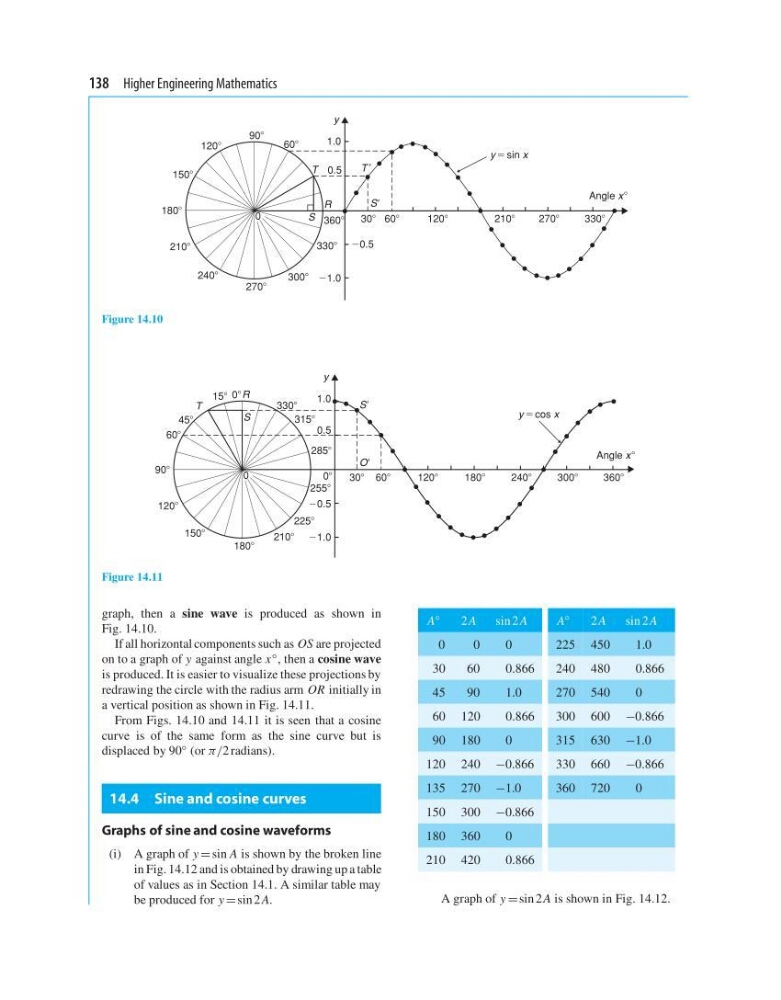
Figure 14.10
20.5
0.5
21.0
1.0
y
S
R
T
S9
O9
y 5 cos x
Angle x 8
308 608
1208
1808
2408
3008
3608
458
08
158
3308
3158
2858
2558
08
2258
2108
1808
1508
1208
908
608
0
Figure 14.11
graph, then a sine wave is produced as shown in
Fig. 14.10.
If all horizontal components such as OS are projected
on to a graph of y against angle x ◦ , then a cosine wave
is produced. It is easier to visualize these projections by
redrawing the circle with the radius arm OR initially in
a vertical position as shown in Fig. 14.11.
From Figs. 14.10 and 14.11 it is seen that a cosine
curve is of the same form as the sine curve but is
displaced by 90 ◦ (or π/2 radians).
14.4 Sine and cosine curves
Graphs of sine and cosine waveforms
(i) A graph of y = sin A is shown by the broken line
in Fig. 14.12 and is obtained by drawing up a table
of values as in Section 14.1. A similar table may
be produced for y = sin 2 A.
A ◦
2 A
sin 2 A
A ◦
2 A
sin 2 A
0
0
0
225 450
1.0
30
60
0.866
240 480
0.866
45
90
1.0
270 540
0
60 120
0.866
300 600 −0.866
90 180
0
315 630 −1.0
120 240 −0.866
330 660 −0.866
135 270 −1.0
360 720
0
150 300 −0.866
180 360
0
210 420
0.866
A graph of y = sin 2 A is shown in Fig. 14.12.
1208
908
608
3608
3308 20.5
21.0
1.0
0.5
T
y
R
S
S9
T 9
y 5 sin x
Angle x 8
308 608
1208
2108
2708
3308
3008
2708
2408
2108
1808
1508
0
Figure 14.10
20.5
0.5
21.0
1.0
y
S
R
T
S9
O9
y 5 cos x
Angle x 8
308 608
1208
1808
2408
3008
3608
458
08
158
3308
3158
2858
2558
08
2258
2108
1808
1508
1208
908
608
0
Figure 14.11
graph, then a sine wave is produced as shown in
Fig. 14.10.
If all horizontal components such as OS are projected
on to a graph of y against angle x ◦ , then a cosine wave
is produced. It is easier to visualize these projections by
redrawing the circle with the radius arm OR initially in
a vertical position as shown in Fig. 14.11.
From Figs. 14.10 and 14.11 it is seen that a cosine
curve is of the same form as the sine curve but is
displaced by 90 ◦ (or π/2 radians).
14.4 Sine and cosine curves
Graphs of sine and cosine waveforms
(i) A graph of y = sin A is shown by the broken line
in Fig. 14.12 and is obtained by drawing up a table
of values as in Section 14.1. A similar table may
be produced for y = sin 2 A.
A ◦
2 A
sin 2 A
A ◦
2 A
sin 2 A
0
0
0
225 450
1.0
30
60
0.866
240 480
0.866
45
90
1.0
270 540
0
60 120
0.866
300 600 −0.866
90 180
0
315 630 −1.0
120 240 −0.866
330 660 −0.866
135 270 −1.0
360 720
0
150 300 −0.866
180 360
0
210 420
0.866
A graph of y = sin 2 A is shown in Fig. 14.12.