

indicate that most of their function rankings are higher than #20. With no functions
ranking below #30, the performances of these cities can be described as highly wellbalanced.
It is a characteristic of these six European cities that they achieve relatively high
compatibility between Economy and Environment. In GPCI-2013, London, #1 in
the comprehensive ranking, ranks #4 for Economy, and #9 for Environment. The
other five cities are mostly in the top half for both functions (except for Vienna being
#21 for Economy). Comparisons with the other regions of the world make this
tendency even more distinct: of eight North American cities in GPCI-2013, Vancouver is the only city that ranks in the top half for both of the functions (#20 for
Economy and #18 for Environment). In Asia, Tokyo, Singapore, and Seoul are the
only three cities that achieve such compatibility. In Fig. 11.2, the six European cities
are placed in region A or E, meaning that they achieve high standings in both
Environment and Economy.
Another characteristic of the six European cities is that many of them are high
performers in other functions. They are remarkable especially in the functions of
Livability, Cultural Interaction, and Accessibility. For Livability, Paris (#1), Vienna
(#2), Amsterdam (#3), and Berlin (#6) lead the ranking. For Cultural Interaction,
London (#1), Paris (#3), Berlin (#5), and Vienna (#7) are in the top ten. For
Accessibility, London (#1), Paris (#2), Frankfurt (#3), and Amsterdam (#4) dominate the top four places. In fact, the six European cities are highly well-balanced:
none of the cities’ functions are ranked lower than #30.
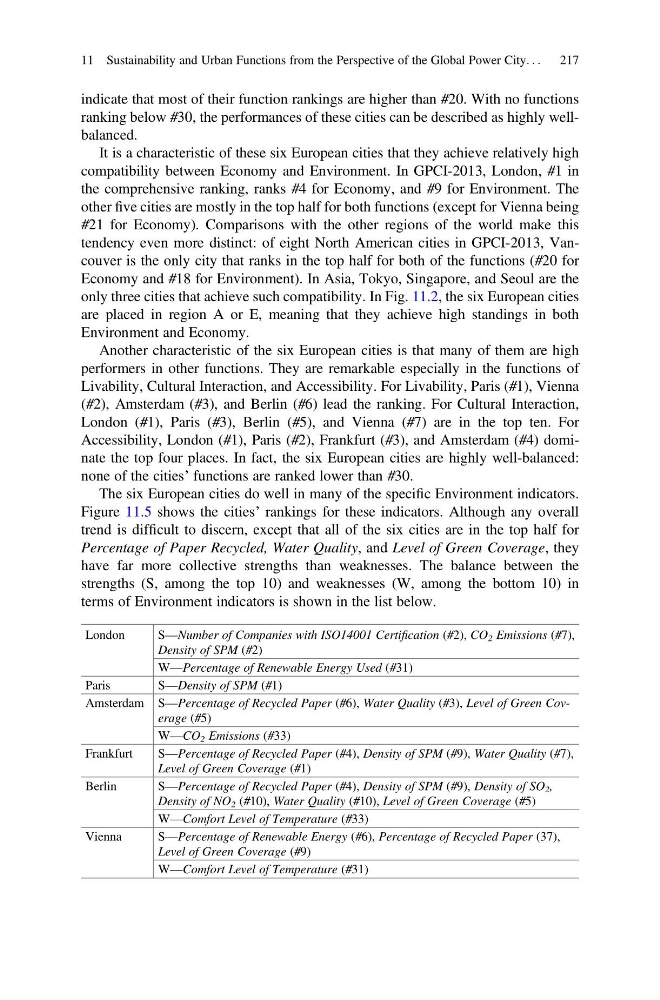
The six European cities do well in many of the specific Environment indicators.
Figure 11.5 shows the cities’ rankings for these indicators. Although any overall
trend is difficult to discern, except that all of the six cities are in the top half for
Percentage of Paper Recycled, Water Quality, and Level of Green Coverage, they
have far more collective strengths than weaknesses. The balance between the
strengths (S, among the top 10) and weaknesses (W, among the bottom 10) in
terms of Environment indicators is shown in the list below.
London
S—Number of Companies with ISO14001 Certification (#2), CO 2 Emissions (#7),
Density of SPM (#2)
W—Percentage of Renewable Energy Used (#31)
Paris
S—Density of SPM (#1)
Amsterdam S—Percentage of Recycled Paper (#6), Water Quality (#3), Level of Green Coverage (#5)
W—CO 2 Emissions (#33)
Frankfurt
S—Percentage of Recycled Paper (#4), Density of SPM (#9), Water Quality (#7),
Level of Green Coverage (#1)
Berlin
S—Percentage of Recycled Paper (#4), Density of SPM (#9), Density of SO 2 ,
Density of NO 2 (#10), Water Quality (#10), Level of Green Coverage (#5)
W—Comfort Level of Temperature (#33)
Vienna
S—Percentage of Renewable Energy (#6), Percentage of Recycled Paper (37),
Level of Green Coverage (#9)
W—Comfort Level of Temperature (#31)
11 Sustainability and Urban Functions from the Perspective of the Global Power City. . .
217
ranking below #30, the performances of these cities can be described as highly wellbalanced.
It is a characteristic of these six European cities that they achieve relatively high
compatibility between Economy and Environment. In GPCI-2013, London, #1 in
the comprehensive ranking, ranks #4 for Economy, and #9 for Environment. The
other five cities are mostly in the top half for both functions (except for Vienna being
#21 for Economy). Comparisons with the other regions of the world make this
tendency even more distinct: of eight North American cities in GPCI-2013, Vancouver is the only city that ranks in the top half for both of the functions (#20 for
Economy and #18 for Environment). In Asia, Tokyo, Singapore, and Seoul are the
only three cities that achieve such compatibility. In Fig. 11.2, the six European cities
are placed in region A or E, meaning that they achieve high standings in both
Environment and Economy.
Another characteristic of the six European cities is that many of them are high
performers in other functions. They are remarkable especially in the functions of
Livability, Cultural Interaction, and Accessibility. For Livability, Paris (#1), Vienna
(#2), Amsterdam (#3), and Berlin (#6) lead the ranking. For Cultural Interaction,
London (#1), Paris (#3), Berlin (#5), and Vienna (#7) are in the top ten. For
Accessibility, London (#1), Paris (#2), Frankfurt (#3), and Amsterdam (#4) dominate the top four places. In fact, the six European cities are highly well-balanced:
none of the cities’ functions are ranked lower than #30.
The six European cities do well in many of the specific Environment indicators.
Figure 11.5 shows the cities’ rankings for these indicators. Although any overall
trend is difficult to discern, except that all of the six cities are in the top half for
Percentage of Paper Recycled, Water Quality, and Level of Green Coverage, they
have far more collective strengths than weaknesses. The balance between the
strengths (S, among the top 10) and weaknesses (W, among the bottom 10) in
terms of Environment indicators is shown in the list below.
London
S—Number of Companies with ISO14001 Certification (#2), CO 2 Emissions (#7),
Density of SPM (#2)
W—Percentage of Renewable Energy Used (#31)
Paris
S—Density of SPM (#1)
Amsterdam S—Percentage of Recycled Paper (#6), Water Quality (#3), Level of Green Coverage (#5)
W—CO 2 Emissions (#33)
Frankfurt
S—Percentage of Recycled Paper (#4), Density of SPM (#9), Water Quality (#7),
Level of Green Coverage (#1)
Berlin
S—Percentage of Recycled Paper (#4), Density of SPM (#9), Density of SO 2 ,
Density of NO 2 (#10), Water Quality (#10), Level of Green Coverage (#5)
W—Comfort Level of Temperature (#33)
Vienna
S—Percentage of Renewable Energy (#6), Percentage of Recycled Paper (37),
Level of Green Coverage (#9)
W—Comfort Level of Temperature (#31)
11 Sustainability and Urban Functions from the Perspective of the Global Power City. . .
217