

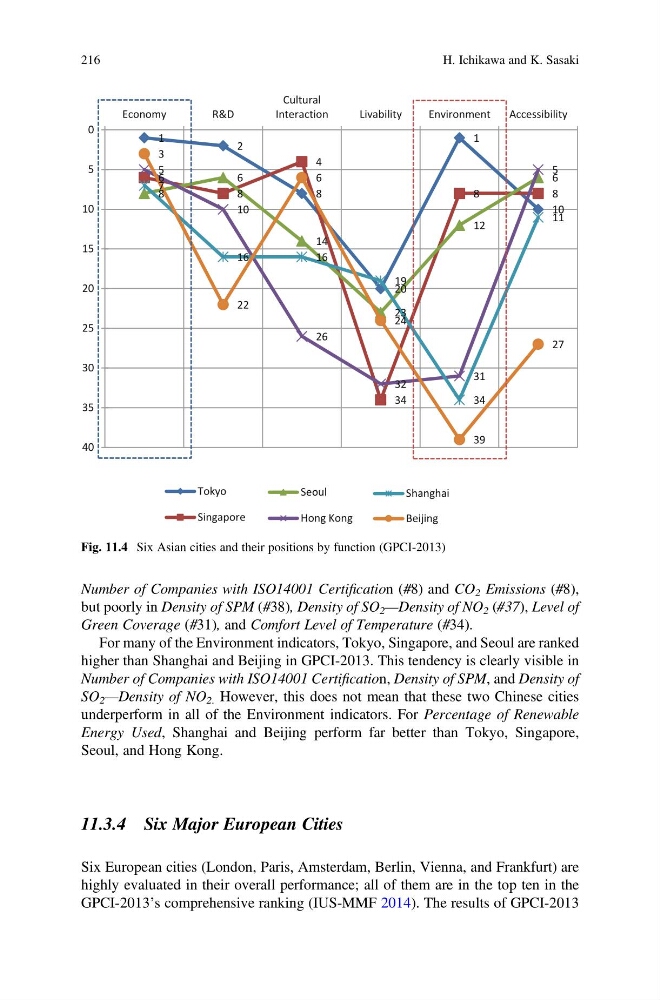
Number of Companies with ISO14001 Certification (#8) and CO 2 Emissions (#8),
but poorly in Density of SPM (#38), Density of SO 2 —Density of NO 2 (#37), Level of
Green Coverage (#31), and Comfort Level of Temperature (#34).
For many of the Environment indicators, Tokyo, Singapore, and Seoul are ranked
higher than Shanghai and Beijing in GPCI-2013. This tendency is clearly visible in
Number of Companies with ISO14001 Certification, Density of SPM, and Density of
SO 2 —Density of NO 2. However, this does not mean that these two Chinese cities
underperform in all of the Environment indicators. For Percentage of Renewable
Energy Used, Shanghai and Beijing perform far better than Tokyo, Singapore,
Seoul, and Hong Kong.
11.3.4 Six Major European Cities
Six European cities (London, Paris, Amsterdam, Berlin, Vienna, and Frankfurt) are
highly evaluated in their overall performance; all of them are in the top ten in the
GPCI-2013’s comprehensive ranking (IUS-MMF 2014). The results of GPCI-2013
1
2
8
20
1
10
6
8
4
34
8
8
8
6
14
23
12
6
5
10
26
32
31
5
7
16
16
19
34
11
3
22
6
24
39
27
0
5
10
15
20
25
30
35
40
Economy
R&D
Cultural
Interaction
Livability
Environment
Accessibility
Tokyo
Singapore
Seoul
Hong Kong
Shanghai
Beijing
Fig. 11.4 Six Asian cities and their positions by function (GPCI-2013)
216
H. Ichikawa and K. Sasaki
but poorly in Density of SPM (#38), Density of SO 2 —Density of NO 2 (#37), Level of
Green Coverage (#31), and Comfort Level of Temperature (#34).
For many of the Environment indicators, Tokyo, Singapore, and Seoul are ranked
higher than Shanghai and Beijing in GPCI-2013. This tendency is clearly visible in
Number of Companies with ISO14001 Certification, Density of SPM, and Density of
SO 2 —Density of NO 2. However, this does not mean that these two Chinese cities
underperform in all of the Environment indicators. For Percentage of Renewable
Energy Used, Shanghai and Beijing perform far better than Tokyo, Singapore,
Seoul, and Hong Kong.
11.3.4 Six Major European Cities
Six European cities (London, Paris, Amsterdam, Berlin, Vienna, and Frankfurt) are
highly evaluated in their overall performance; all of them are in the top ten in the
GPCI-2013’s comprehensive ranking (IUS-MMF 2014). The results of GPCI-2013
1
2
8
20
1
10
6
8
4
34
8
8
8
6
14
23
12
6
5
10
26
32
31
5
7
16
16
19
34
11
3
22
6
24
39
27
0
5
10
15
20
25
30
35
40
Economy
R&D
Cultural
Interaction
Livability
Environment
Accessibility
Tokyo
Singapore
Seoul
Hong Kong
Shanghai
Beijing
Fig. 11.4 Six Asian cities and their positions by function (GPCI-2013)
216
H. Ichikawa and K. Sasaki