

11.3.5 GDP Indicators and the Environment Score
As we have already observed the varied relationship between the cities’ scores for
Economy and Environment, it may be important to further focus on some of the
Economy indicators. The GPCI’s Economy category includes indicators such as
Number of Employees and Corporate Tax Rate, which are arguably less relevant to
the issue of sustainability than other Economy indicators. It may then be of interest to
select some Economy indicators, such as indicators concerning Gross Domestic
Product (GDP)—Nominal GDP, GDP per Capita, and GDP Growth
11
—as they are
expected to have greater relevance to the score for Environment.
Figures 11.6, 11.7, and 11.8 illustrate the comparison between the GPCI cities’
average scores for all nine indicators under Environment and the three GDP-related
indicators under Economy (Nominal GDP, GDP per Capita, and GDP Growth). The
charts in Fig. 11.9 show the distribution of the cities in relation to the two variables
compared.
2
31
16
7
2
30
11
19
19
12
20
18
17
1
23
15
19
23
28
30
6
33
30
21
3
5
30
30
16
4
28
9
14
7
1
27
18
16
4
28
9
10
10
5
33
21
4
7
23
28
17
12
9
31
0
5
10
15
20
25
30
35
40
ISO 14001
Renewable
Energy
Recycled
Paper
CO2
Emissions SPM Density
SO2&NO2
Density Water Quality
Green
Coverage Temperature
London
Paris
Amsterdam
Frankfurt
Berlin
Vienna
S
W
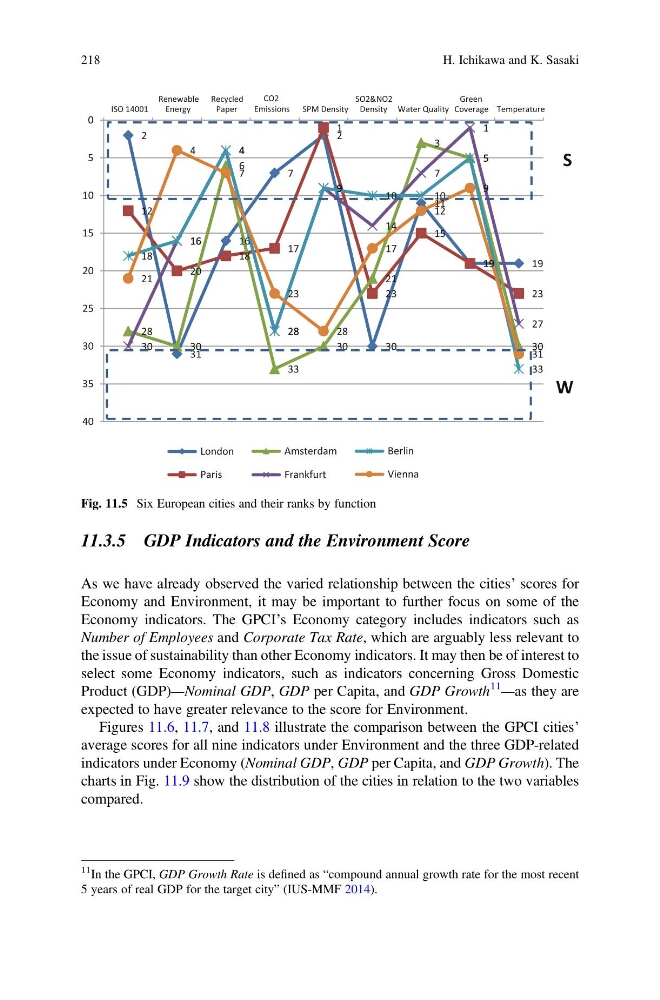
Fig. 11.5 Six European cities and their ranks by function
11 In the GPCI, GDP Growth Rate is defined as “compound annual growth rate for the most recent
5 years of real GDP for the target city” (IUS-MMF 2014).
218
H. Ichikawa and K. Sasaki
As we have already observed the varied relationship between the cities’ scores for
Economy and Environment, it may be important to further focus on some of the
Economy indicators. The GPCI’s Economy category includes indicators such as
Number of Employees and Corporate Tax Rate, which are arguably less relevant to
the issue of sustainability than other Economy indicators. It may then be of interest to
select some Economy indicators, such as indicators concerning Gross Domestic
Product (GDP)—Nominal GDP, GDP per Capita, and GDP Growth
11
—as they are
expected to have greater relevance to the score for Environment.
Figures 11.6, 11.7, and 11.8 illustrate the comparison between the GPCI cities’
average scores for all nine indicators under Environment and the three GDP-related
indicators under Economy (Nominal GDP, GDP per Capita, and GDP Growth). The
charts in Fig. 11.9 show the distribution of the cities in relation to the two variables
compared.
2
31
16
7
2
30
11
19
19
12
20
18
17
1
23
15
19
23
28
30
6
33
30
21
3
5
30
30
16
4
28
9
14
7
1
27
18
16
4
28
9
10
10
5
33
21
4
7
23
28
17
12
9
31
0
5
10
15
20
25
30
35
40
ISO 14001
Renewable
Energy
Recycled
Paper
CO2
Emissions SPM Density
SO2&NO2
Density Water Quality
Green
Coverage Temperature
London
Paris
Amsterdam
Frankfurt
Berlin
Vienna
S
W
Fig. 11.5 Six European cities and their ranks by function
11 In the GPCI, GDP Growth Rate is defined as “compound annual growth rate for the most recent
5 years of real GDP for the target city” (IUS-MMF 2014).
218
H. Ichikawa and K. Sasaki