

patterns are visible by the gap between the two lines, each representing Environment
and Economy.
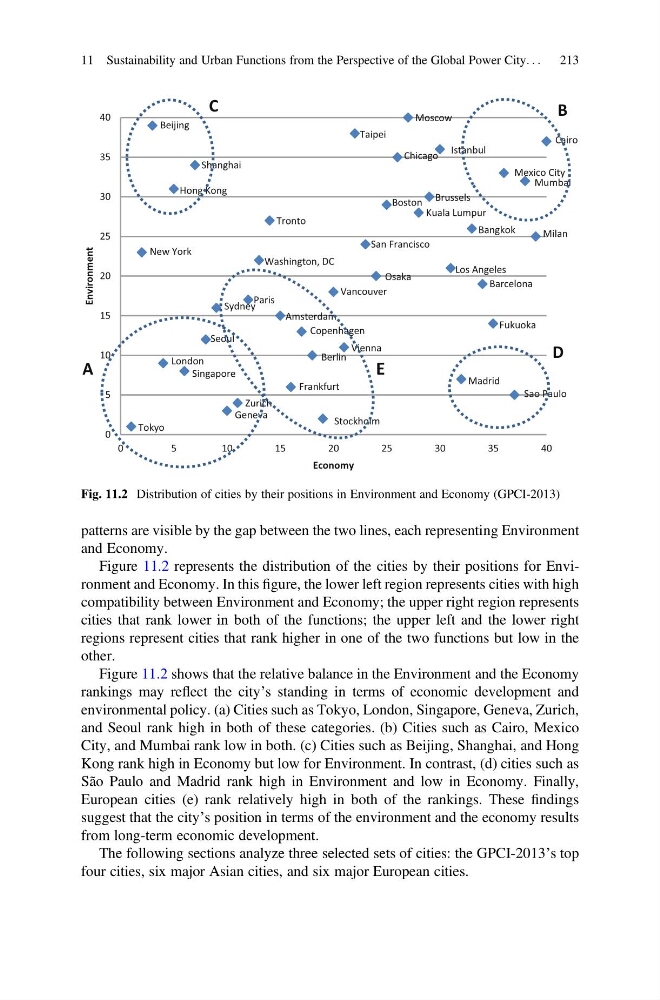
Figure 11.2 represents the distribution of the cities by their positions for Environment and Economy. In this figure, the lower left region represents cities with high
compatibility between Environment and Economy; the upper right region represents
cities that rank lower in both of the functions; the upper left and the lower right
regions represent cities that rank higher in one of the two functions but low in the
other.
Figure 11.2 shows that the relative balance in the Environment and the Economy
rankings may reflect the city’s standing in terms of economic development and
environmental policy. (a) Cities such as Tokyo, London, Singapore, Geneva, Zurich,
and Seoul rank high in both of these categories. (b) Cities such as Cairo, Mexico
City, and Mumbai rank low in both. (c) Cities such as Beijing, Shanghai, and Hong
Kong rank high in Economy but low for Environment. In contrast, (d) cities such as
São Paulo and Madrid rank high in Environment and low in Economy. Finally,
European cities (e) rank relatively high in both of the rankings. These findings
suggest that the city’s position in terms of the environment and the economy results
from long-term economic development.
The following sections analyze three selected sets of cities: the GPCI-2013’s top
four cities, six major Asian cities, and six major European cities.
0
5
10
15
20
25
30
35
40
0
5
10
15
20
25
30
35
40
Environment
Economy
Tokyo
London
New York
Singapore
Cairo
Milan
Beijing
Moscow
Sao Paulo
Madrid
Hong Kong
Shanghai
Geneva
Zurich
Stockholm
Vancouver
Paris
Seoul
Mumbai
Mexico City
Istanbul
Fukuoka
Frankfurt
Berlin
Vienna
Copenhagen
Sydney
Washington, DC
Tronto
San Francisco
Amsterdam
Osaka
Boston
Taipei
Chicago
Brussels
Kuala Lumpur
Bangkok
Los Angeles
Barcelona
A
B
C
D
E
Fig. 11.2 Distribution of cities by their positions in Environment and Economy (GPCI-2013)
11 Sustainability and Urban Functions from the Perspective of the Global Power City. . .
213
and Economy.
Figure 11.2 represents the distribution of the cities by their positions for Environment and Economy. In this figure, the lower left region represents cities with high
compatibility between Environment and Economy; the upper right region represents
cities that rank lower in both of the functions; the upper left and the lower right
regions represent cities that rank higher in one of the two functions but low in the
other.
Figure 11.2 shows that the relative balance in the Environment and the Economy
rankings may reflect the city’s standing in terms of economic development and
environmental policy. (a) Cities such as Tokyo, London, Singapore, Geneva, Zurich,
and Seoul rank high in both of these categories. (b) Cities such as Cairo, Mexico
City, and Mumbai rank low in both. (c) Cities such as Beijing, Shanghai, and Hong
Kong rank high in Economy but low for Environment. In contrast, (d) cities such as
São Paulo and Madrid rank high in Environment and low in Economy. Finally,
European cities (e) rank relatively high in both of the rankings. These findings
suggest that the city’s position in terms of the environment and the economy results
from long-term economic development.
The following sections analyze three selected sets of cities: the GPCI-2013’s top
four cities, six major Asian cities, and six major European cities.
0
5
10
15
20
25
30
35
40
0
5
10
15
20
25
30
35
40
Environment
Economy
Tokyo
London
New York
Singapore
Cairo
Milan
Beijing
Moscow
Sao Paulo
Madrid
Hong Kong
Shanghai
Geneva
Zurich
Stockholm
Vancouver
Paris
Seoul
Mumbai
Mexico City
Istanbul
Fukuoka
Frankfurt
Berlin
Vienna
Copenhagen
Sydney
Washington, DC
Tronto
San Francisco
Amsterdam
Osaka
Boston
Taipei
Chicago
Brussels
Kuala Lumpur
Bangkok
Los Angeles
Barcelona
A
B
C
D
E
Fig. 11.2 Distribution of cities by their positions in Environment and Economy (GPCI-2013)
11 Sustainability and Urban Functions from the Perspective of the Global Power City. . .
213