

11.3.2 GPCI’s Top Four Cities: London, New York, Paris,
and Tokyo
An analysis of the GPCI-2013’s top four cities (London, New York, Paris, and
Tokyo) reveals some patterns. The four cities are high performers in many of the six
urban functions of the GPCI and the best overall achievers among all 40 cities. All of
these cities are among the top ten in four or five functions.
However, the cities’ scores for Environment vary, reflecting their particular
patterns of economic development. Above all, London, New York, and Tokyo
rank in the top ten for Economy (with Paris being #12), but Tokyo and London
rank much higher than New York and Paris. Paris, with its excellence in Livability
(#1), Cultural Interaction (#3), and Accessibility (#2), ranks #17 in Environment.
The relative advantages that Tokyo and London have over New York and Paris
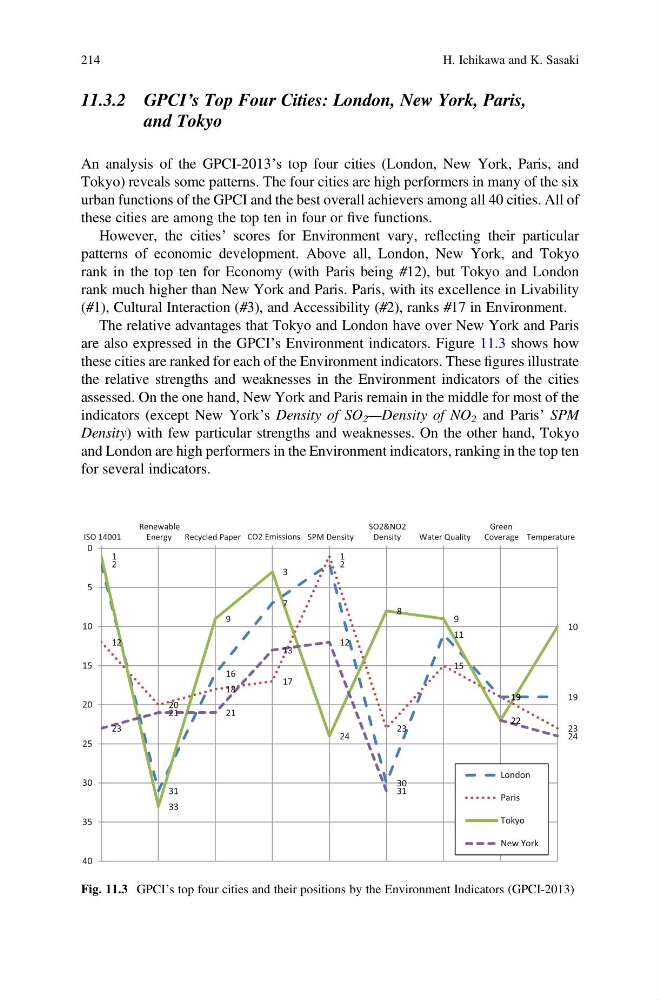
are also expressed in the GPCI’s Environment indicators. Figure 11.3 shows how
these cities are ranked for each of the Environment indicators. These figures illustrate
the relative strengths and weaknesses in the Environment indicators of the cities
assessed. On the one hand, New York and Paris remain in the middle for most of the
indicators (except New York’s Density of SO 2 —Density of NO 2 and Paris’ SPM
Density) with few particular strengths and weaknesses. On the other hand, Tokyo
and London are high performers in the Environment indicators, ranking in the top ten
for several indicators.
2
31
16
7
2
30
11
19
19
12
20
18
17
1
23
15
19
23
1
33
9
3
24
8
9
22
10
23
21
21
13
12
31
22
24
0
5
10
15
20
25
30
35
40
ISO 14001
Renewable
Energy Recycled Paper CO2 Emissions SPM Density
SO2&NO2
Density
Water Quality
Green
Coverage Temperature
London
Paris
Tokyo
New York
Fig. 11.3 GPCI’s top four cities and their positions by the Environment Indicators (GPCI-2013)
214
H. Ichikawa and K. Sasaki
and Tokyo
An analysis of the GPCI-2013’s top four cities (London, New York, Paris, and
Tokyo) reveals some patterns. The four cities are high performers in many of the six
urban functions of the GPCI and the best overall achievers among all 40 cities. All of
these cities are among the top ten in four or five functions.
However, the cities’ scores for Environment vary, reflecting their particular
patterns of economic development. Above all, London, New York, and Tokyo
rank in the top ten for Economy (with Paris being #12), but Tokyo and London
rank much higher than New York and Paris. Paris, with its excellence in Livability
(#1), Cultural Interaction (#3), and Accessibility (#2), ranks #17 in Environment.
The relative advantages that Tokyo and London have over New York and Paris
are also expressed in the GPCI’s Environment indicators. Figure 11.3 shows how
these cities are ranked for each of the Environment indicators. These figures illustrate
the relative strengths and weaknesses in the Environment indicators of the cities
assessed. On the one hand, New York and Paris remain in the middle for most of the
indicators (except New York’s Density of SO 2 —Density of NO 2 and Paris’ SPM
Density) with few particular strengths and weaknesses. On the other hand, Tokyo
and London are high performers in the Environment indicators, ranking in the top ten
for several indicators.
2
31
16
7
2
30
11
19
19
12
20
18
17
1
23
15
19
23
1
33
9
3
24
8
9
22
10
23
21
21
13
12
31
22
24
0
5
10
15
20
25
30
35
40
ISO 14001
Renewable
Energy Recycled Paper CO2 Emissions SPM Density
SO2&NO2
Density
Water Quality
Green
Coverage Temperature
London
Paris
Tokyo
New York
Fig. 11.3 GPCI’s top four cities and their positions by the Environment Indicators (GPCI-2013)
214
H. Ichikawa and K. Sasaki