

179
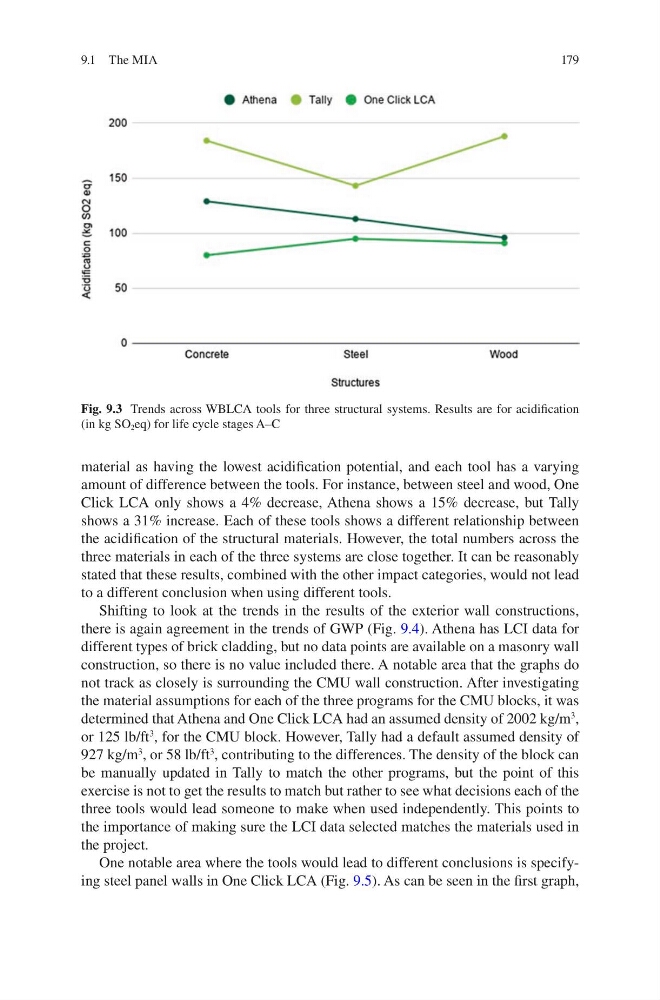
material as having the lowest acidification potential, and each tool has a varying
amount of difference between the tools. For instance, between steel and wood, One
Click LCA only shows a 4% decrease, Athena shows a 15% decrease, but Tally
shows a 31% increase. Each of these tools shows a different relationship between
the acidification of the structural materials. However, the total numbers across the
three materials in each of the three systems are close together. It can be reasonably
stated that these results, combined with the other impact categories, would not lead
to a different conclusion when using different tools.
Shifting to look at the trends in the results of the exterior wall constructions,
there is again agreement in the trends of GWP (Fig. 9.4). Athena has LCI data for
different types of brick cladding, but no data points are available on a masonry wall
construction, so there is no value included there. A notable area that the graphs do
not track as closely is surrounding the CMU wall construction. After investigating
the material assumptions for each of the three programs for the CMU blocks, it was
determined that Athena and One Click LCA had an assumed density of 2002 kg/m
3
,
or 125 lb/ft
3
, for the CMU block. However, Tally had a default assumed density of
927 kg/m
3
, or 58 lb/ft
3
, contributing to the differences. The density of the block can
be manually updated in Tally to match the other programs, but the point of this
exercise is not to get the results to match but rather to see what decisions each of the
three tools would lead someone to make when used independently. This points to
the importance of making sure the LCI data selected matches the materials used in
the project.
One notable area where the tools would lead to different conclusions is specifying steel panel walls in One Click LCA (Fig. 9.5). As can be seen in the first graph,
Fig. 9.3 Trends across WBLCA tools for three structural systems. Results are for acidification
(in kg SO 2 eq) for life cycle stages A–C
9.1 The MIA
material as having the lowest acidification potential, and each tool has a varying
amount of difference between the tools. For instance, between steel and wood, One
Click LCA only shows a 4% decrease, Athena shows a 15% decrease, but Tally
shows a 31% increase. Each of these tools shows a different relationship between
the acidification of the structural materials. However, the total numbers across the
three materials in each of the three systems are close together. It can be reasonably
stated that these results, combined with the other impact categories, would not lead
to a different conclusion when using different tools.
Shifting to look at the trends in the results of the exterior wall constructions,
there is again agreement in the trends of GWP (Fig. 9.4). Athena has LCI data for
different types of brick cladding, but no data points are available on a masonry wall
construction, so there is no value included there. A notable area that the graphs do
not track as closely is surrounding the CMU wall construction. After investigating
the material assumptions for each of the three programs for the CMU blocks, it was
determined that Athena and One Click LCA had an assumed density of 2002 kg/m
3
,
or 125 lb/ft
3
, for the CMU block. However, Tally had a default assumed density of
927 kg/m
3
, or 58 lb/ft
3
, contributing to the differences. The density of the block can
be manually updated in Tally to match the other programs, but the point of this
exercise is not to get the results to match but rather to see what decisions each of the
three tools would lead someone to make when used independently. This points to
the importance of making sure the LCI data selected matches the materials used in
the project.
One notable area where the tools would lead to different conclusions is specifying steel panel walls in One Click LCA (Fig. 9.5). As can be seen in the first graph,
Fig. 9.3 Trends across WBLCA tools for three structural systems. Results are for acidification
(in kg SO 2 eq) for life cycle stages A–C
9.1 The MIA