

178
9.1.2 Results
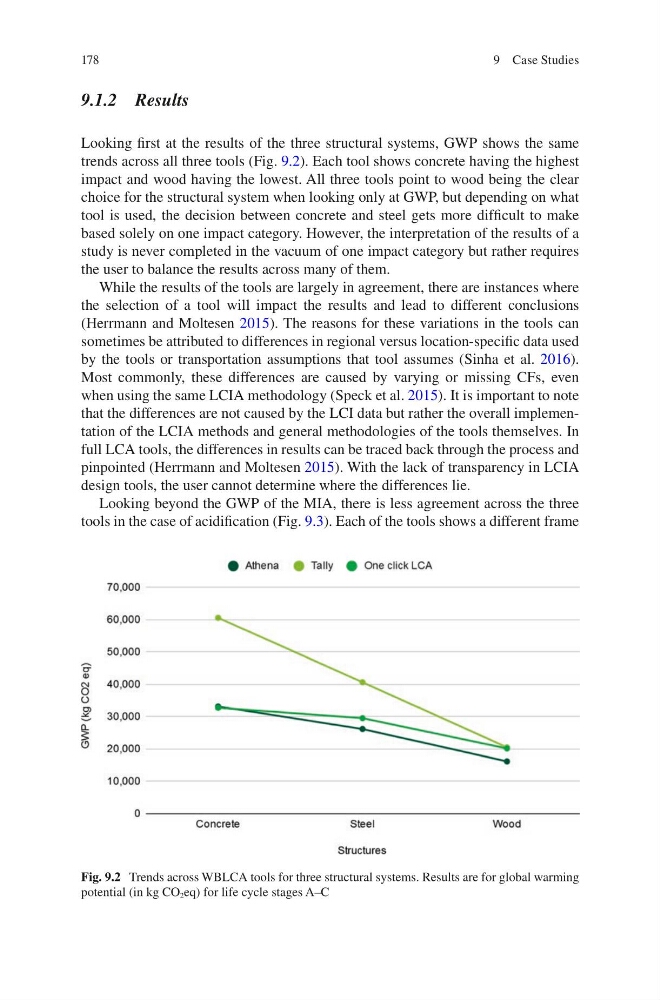
Looking first at the results of the three structural systems, GWP shows the same
trends across all three tools (Fig. 9.2). Each tool shows concrete having the highest
impact and wood having the lowest. All three tools point to wood being the clear
choice for the structural system when looking only at GWP, but depending on what
tool is used, the decision between concrete and steel gets more difficult to make
based solely on one impact category. However, the interpretation of the results of a
study is never completed in the vacuum of one impact category but rather requires
the user to balance the results across many of them.
While the results of the tools are largely in agreement, there are instances where
the selection of a tool will impact the results and lead to different conclusions
(Herrmann and Moltesen 2015). The reasons for these variations in the tools can
sometimes be attributed to differences in regional versus location-specific data used
by the tools or transportation assumptions that tool assumes (Sinha et al. 2016).
Most commonly, these differences are caused by varying or missing CFs, even
when using the same LCIA methodology (Speck et al. 2015). It is important to note
that the differences are not caused by the LCI data but rather the overall implementation of the LCIA methods and general methodologies of the tools themselves. In
full LCA tools, the differences in results can be traced back through the process and
pinpointed (Herrmann and Moltesen 2015). With the lack of transparency in LCIA
design tools, the user cannot determine where the differences lie.
Looking beyond the GWP of the MIA, there is less agreement across the three
tools in the case of acidification (Fig. 9.3). Each of the tools shows a different frame
Fig. 9.2 Trends across WBLCA tools for three structural systems. Results are for global warming
potential (in kg CO 2 eq) for life cycle stages A–C
9 Case Studies
9.1.2 Results
Looking first at the results of the three structural systems, GWP shows the same
trends across all three tools (Fig. 9.2). Each tool shows concrete having the highest
impact and wood having the lowest. All three tools point to wood being the clear
choice for the structural system when looking only at GWP, but depending on what
tool is used, the decision between concrete and steel gets more difficult to make
based solely on one impact category. However, the interpretation of the results of a
study is never completed in the vacuum of one impact category but rather requires
the user to balance the results across many of them.
While the results of the tools are largely in agreement, there are instances where
the selection of a tool will impact the results and lead to different conclusions
(Herrmann and Moltesen 2015). The reasons for these variations in the tools can
sometimes be attributed to differences in regional versus location-specific data used
by the tools or transportation assumptions that tool assumes (Sinha et al. 2016).
Most commonly, these differences are caused by varying or missing CFs, even
when using the same LCIA methodology (Speck et al. 2015). It is important to note
that the differences are not caused by the LCI data but rather the overall implementation of the LCIA methods and general methodologies of the tools themselves. In
full LCA tools, the differences in results can be traced back through the process and
pinpointed (Herrmann and Moltesen 2015). With the lack of transparency in LCIA
design tools, the user cannot determine where the differences lie.
Looking beyond the GWP of the MIA, there is less agreement across the three
tools in the case of acidification (Fig. 9.3). Each of the tools shows a different frame
Fig. 9.2 Trends across WBLCA tools for three structural systems. Results are for global warming
potential (in kg CO 2 eq) for life cycle stages A–C
9 Case Studies