

153
8.4.3.5 View Results
Tally takes all of this information and combines it into a final PDF report of LCIA
results. This shows an overview of the study and results. The “Report Summary”
quickly outlines key information and assumptions about the study. Then, the results
of the study are broken down by impact category and life cycle stage. The impact
categories included in Tally are GWP (in kg CO 2 eq), acidification potential (in kg
SO 2 eq), eutrophication potential (in kg Neq), smog formation potential (in kg O 3 eq),
ozone depletion potential (in kg CFC-11eq), Primary energy (in MJ), nonrenewable
energy (in MJ), and renewable energy (in MJ). Of these impact categories, the
impacts of GWP, acidification potential, eutrophication potential, smog formation
potential, and nonrenewable energy are prioritized and broken down graphically by
life cycle stage, division, Tally entry, Revit category, and Revit family (Fig. 8.12).
All of these different ways of breaking down the results are helpful in identifying
any hotspots where the largest environmental impacts are found to help the designer
focus their attention on the most impactful areas of the project, as seen in Sect.
9.1.2. The rest of the report generated by Tally provides critical information about
the methodologies and assumptions of the study, most of which are pre-established
by Tally and out of the hands of the designer. All of this information is crucial to
revealing the parts of the process that happen without user input. Along with this
final report, Tally also generates an excel spreadsheet that gives a more detailed
breakdown of all of the impact categories across the same life cycle stages,
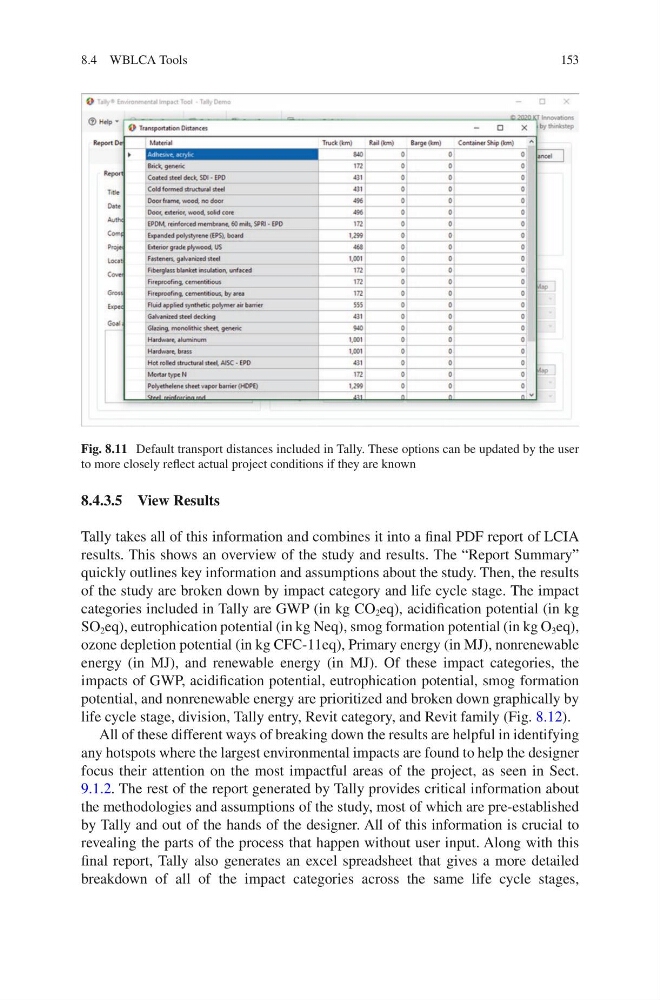
Fig. 8.11 Default transport distances included in Tally. These options can be updated by the user
to more closely reflect actual project conditions if they are known
8.4 WBLCA Tools
8.4.3.5 View Results
Tally takes all of this information and combines it into a final PDF report of LCIA
results. This shows an overview of the study and results. The “Report Summary”
quickly outlines key information and assumptions about the study. Then, the results
of the study are broken down by impact category and life cycle stage. The impact
categories included in Tally are GWP (in kg CO 2 eq), acidification potential (in kg
SO 2 eq), eutrophication potential (in kg Neq), smog formation potential (in kg O 3 eq),
ozone depletion potential (in kg CFC-11eq), Primary energy (in MJ), nonrenewable
energy (in MJ), and renewable energy (in MJ). Of these impact categories, the
impacts of GWP, acidification potential, eutrophication potential, smog formation
potential, and nonrenewable energy are prioritized and broken down graphically by
life cycle stage, division, Tally entry, Revit category, and Revit family (Fig. 8.12).
All of these different ways of breaking down the results are helpful in identifying
any hotspots where the largest environmental impacts are found to help the designer
focus their attention on the most impactful areas of the project, as seen in Sect.
9.1.2. The rest of the report generated by Tally provides critical information about
the methodologies and assumptions of the study, most of which are pre-established
by Tally and out of the hands of the designer. All of this information is crucial to
revealing the parts of the process that happen without user input. Along with this
final report, Tally also generates an excel spreadsheet that gives a more detailed
breakdown of all of the impact categories across the same life cycle stages,
Fig. 8.11 Default transport distances included in Tally. These options can be updated by the user
to more closely reflect actual project conditions if they are known
8.4 WBLCA Tools