

36
Internet of Things (IoT)
a given person in the correct cluster is given by recall. Recall is calculated by the diagonal
value for a column and the sum of the column. Recall of K-means for person 1 is reasonably high, fair for person 0, but low for person 2 and 3. F-measure is the harmonic mean of
precision and recall. F-measure is calculated as:
F = ×
×
+
2
precision recall
precision recall
(2.11)
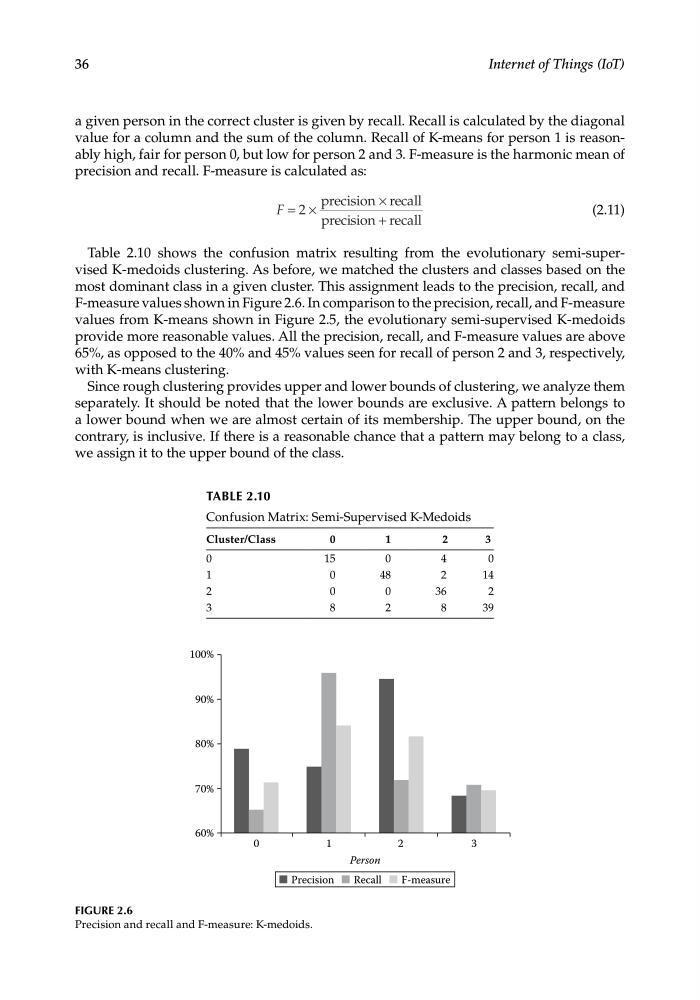
Table 2.10 shows the confusion matrix resulting from the evolutionary semi-supervised K-medoids clustering. As before, we matched the clusters and classes based on the
most dominant class in a given cluster. This assignment leads to the precision, recall, and
F-measure values shown in Figure 2.6. In comparison to the precision, recall, and F-measure
values from K-means shown in Figure 2.5, the evolutionary semi-supervised K-medoids
provide more reasonable values. All the precision, recall, and F-measure values are above
65%, as opposed to the 40% and 45% values seen for recall of person 2 and 3, respectively,
with K-means clustering.
Since rough clustering provides upper and lower bounds of clustering, we analyze them
separately. It should be noted that the lower bounds are exclusive. A pattern belongs to
a lower bound when we are almost certain of its membership. The upper bound, on the
contrary, is inclusive. If there is a reasonable chance that a pattern may belong to a class,
we assign it to the upper bound of the class.
100%
90%
80%
70%
60%
0
1
Person
2
3
Precision
Recall
F-measure
FIGURE 2.6
Precision and recall and F-measure: K-medoids.
TABLE 2.10
Confusion Matrix: Semi-Supervised K-Medoids
Cluster/Class
0
1
2
3
0
15
0
4
0
1
0
48
2
14
2
0
0
36
2
3
8
2
8
39
Internet of Things (IoT)
a given person in the correct cluster is given by recall. Recall is calculated by the diagonal
value for a column and the sum of the column. Recall of K-means for person 1 is reasonably high, fair for person 0, but low for person 2 and 3. F-measure is the harmonic mean of
precision and recall. F-measure is calculated as:
F = ×
×
+
2
precision recall
precision recall
(2.11)
Table 2.10 shows the confusion matrix resulting from the evolutionary semi-supervised K-medoids clustering. As before, we matched the clusters and classes based on the
most dominant class in a given cluster. This assignment leads to the precision, recall, and
F-measure values shown in Figure 2.6. In comparison to the precision, recall, and F-measure
values from K-means shown in Figure 2.5, the evolutionary semi-supervised K-medoids
provide more reasonable values. All the precision, recall, and F-measure values are above
65%, as opposed to the 40% and 45% values seen for recall of person 2 and 3, respectively,
with K-means clustering.
Since rough clustering provides upper and lower bounds of clustering, we analyze them
separately. It should be noted that the lower bounds are exclusive. A pattern belongs to
a lower bound when we are almost certain of its membership. The upper bound, on the
contrary, is inclusive. If there is a reasonable chance that a pattern may belong to a class,
we assign it to the upper bound of the class.
100%
90%
80%
70%
60%
0
1
Person
2
3
Precision
Recall
F-measure
FIGURE 2.6
Precision and recall and F-measure: K-medoids.
TABLE 2.10
Confusion Matrix: Semi-Supervised K-Medoids
Cluster/Class
0
1
2
3
0
15
0
4
0
1
0
48
2
14
2
0
0
36
2
3
8
2
8
39