

37
Identification from Wearable Device Brain Signals
Table 2.11(a) shows the confusion matrix of upper bounds resulting from the evolutionary semi-supervised rough K-medoids clustering. As before, we matched the clusters and
classes based on the most dominant class in a given cluster. The cluster and class matching
from the lower bounds was used to create the confusion matrix shown in Table 2.11(b).
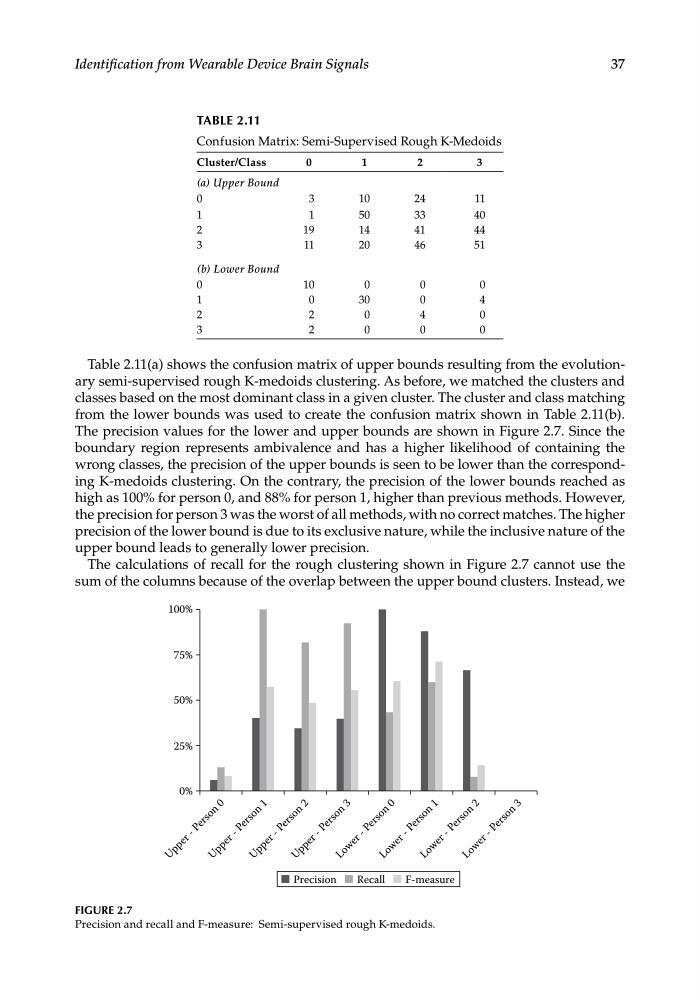
The precision values for the lower and upper bounds are shown in Figure 2.7. Since the
boundary region represents ambivalence and has a higher likelihood of containing the
wrong classes, the precision of the upper bounds is seen to be lower than the corresponding K-medoids clustering. On the contrary, the precision of the lower bounds reached as
high as 100% for person 0, and 88% for person 1, higher than previous methods. However,
the precision for person 3 was the worst of all methods, with no correct matches. The higher
precision of the lower bound is due to its exclusive nature, while the inclusive nature of the
upper bound leads to generally lower precision.
The calculations of recall for the rough clustering shown in Figure 2.7 cannot use the
sum of the columns because of the overlap between the upper bound clusters. Instead, we
TABLE 2.11
Confusion Matrix: Semi-Supervised Rough K-Medoids
Cluster/Class
0
1
2
3
(a) Upper Bound
0
3
10
24
11
1
1
50
33
40
2
19
14
41
44
3
11
20
46
51
(b) Lower Bound
0
10
0
0
0
1
0
30
0
4
2
2
0
4
0
3
2
0
0
0
100%
75%
50%
25%
0%
U
p p e r - P e r s o n
0
U
p p e r - P e r s o n
1
U
p p e r - P e r s o n
2
U
p p e r - P e r s o n
3
L o w
e r - P e r s o n
0
L o w
e r - P e r s o n
1
L o w
e r - P e r s o n
2
L o w
e r - P e r s o n
3
Precision
Recall
F-measure
FIGURE 2.7
Precision and recall and F-measure: Semi-supervised rough K-medoids.
Identification from Wearable Device Brain Signals
Table 2.11(a) shows the confusion matrix of upper bounds resulting from the evolutionary semi-supervised rough K-medoids clustering. As before, we matched the clusters and
classes based on the most dominant class in a given cluster. The cluster and class matching
from the lower bounds was used to create the confusion matrix shown in Table 2.11(b).
The precision values for the lower and upper bounds are shown in Figure 2.7. Since the
boundary region represents ambivalence and has a higher likelihood of containing the
wrong classes, the precision of the upper bounds is seen to be lower than the corresponding K-medoids clustering. On the contrary, the precision of the lower bounds reached as
high as 100% for person 0, and 88% for person 1, higher than previous methods. However,
the precision for person 3 was the worst of all methods, with no correct matches. The higher
precision of the lower bound is due to its exclusive nature, while the inclusive nature of the
upper bound leads to generally lower precision.
The calculations of recall for the rough clustering shown in Figure 2.7 cannot use the
sum of the columns because of the overlap between the upper bound clusters. Instead, we
TABLE 2.11
Confusion Matrix: Semi-Supervised Rough K-Medoids
Cluster/Class
0
1
2
3
(a) Upper Bound
0
3
10
24
11
1
1
50
33
40
2
19
14
41
44
3
11
20
46
51
(b) Lower Bound
0
10
0
0
0
1
0
30
0
4
2
2
0
4
0
3
2
0
0
0
100%
75%
50%
25%
0%
U
p p e r - P e r s o n
0
U
p p e r - P e r s o n
1
U
p p e r - P e r s o n
2
U
p p e r - P e r s o n
3
L o w
e r - P e r s o n
0
L o w
e r - P e r s o n
1
L o w
e r - P e r s o n
2
L o w
e r - P e r s o n
3
Precision
Recall
F-measure
FIGURE 2.7
Precision and recall and F-measure: Semi-supervised rough K-medoids.